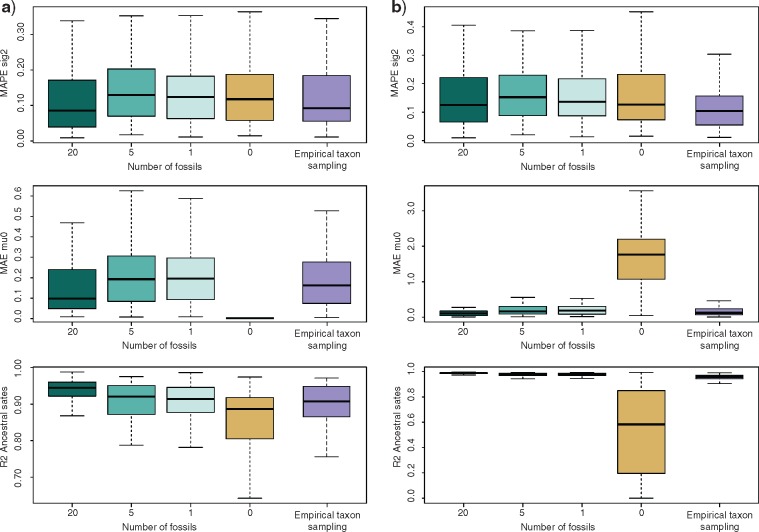
Figure 2.
Accuracy of parameter estimation summarized across 100 simulations under Scenarios 1 and 2 and different levels of sampling. – The simulations assumed a constant rate Brownian evolution and either no trend ( , A) or a positive or negative evolutionary trend (
 0; B). We tested decreasing number of fossils (20, 5, 1, and 0) and incomplete taxon sampling at the present. The latter setting (purple plots) was based on trees that reflected the size and sampling of the platyrrhine phylogeny analyzed here (200 extant taxa, 44% of which are sampled and 20 fossils). When the number of fossils was set to 0, only extant taxa were included in the analysis and the trend parameter (
 was not estimated but set to 0.

