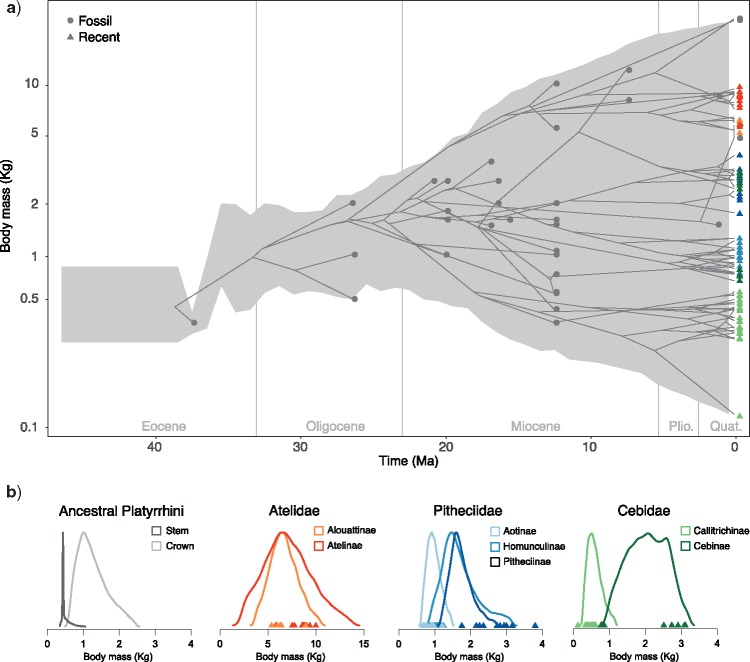
Figure 3.
Body mass evolution in New World Monkeys. A) The gray shaded area shows the range of trait values (log-transformed body mass) through time (95% credible interval) inferred across a sample of 100 phylogenies with extinct and extant taxa (one of which was chosen randomly as an example). The grey circles indicate the body mass and age of the fossil taxa included in the analysis, and the blue triangles show the log body mass of extant species. B) The density plots show the estimated ancestral body mass (posterior distributions truncated to their 95% credible intervals) across subfamilies, for the most recent common ancestor of extant platyrrhines and at the root of the tree.

