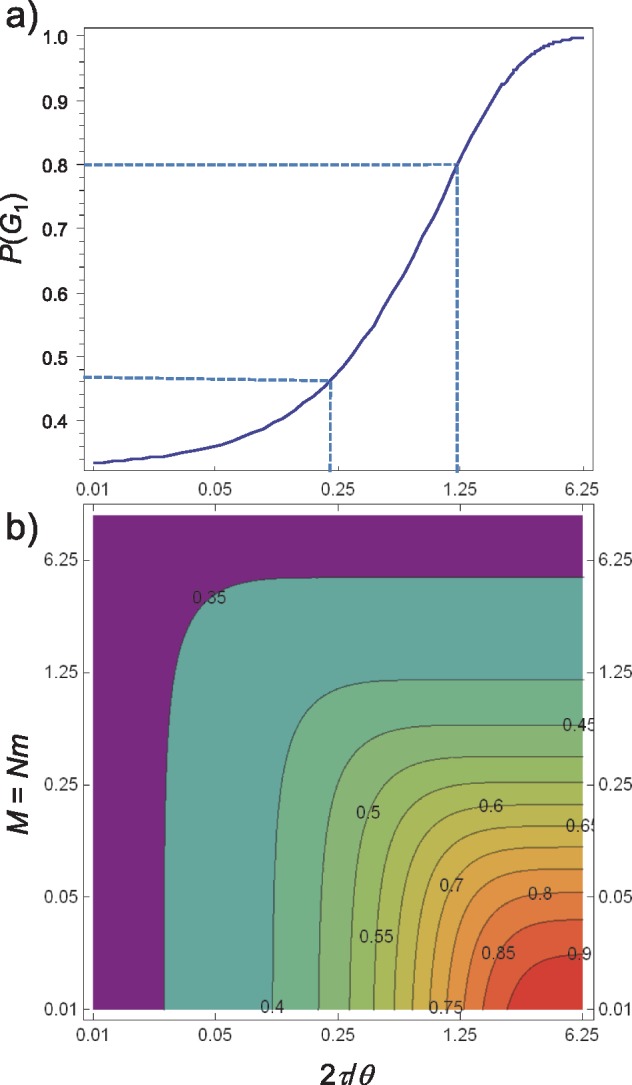
Figure 3.

Probability  of gene tree
  , plotted (a) as a function of population divergence in coalescent units (
 ) in a pure isolation model for two populations without gene flow and (b) as a function of population divergence in coalescent units (
 ) and scaled migration rate
  . According to Jackson et al. (2017), the lower and upper limits of
  for species delimitation are 0.47 and 0.8.
