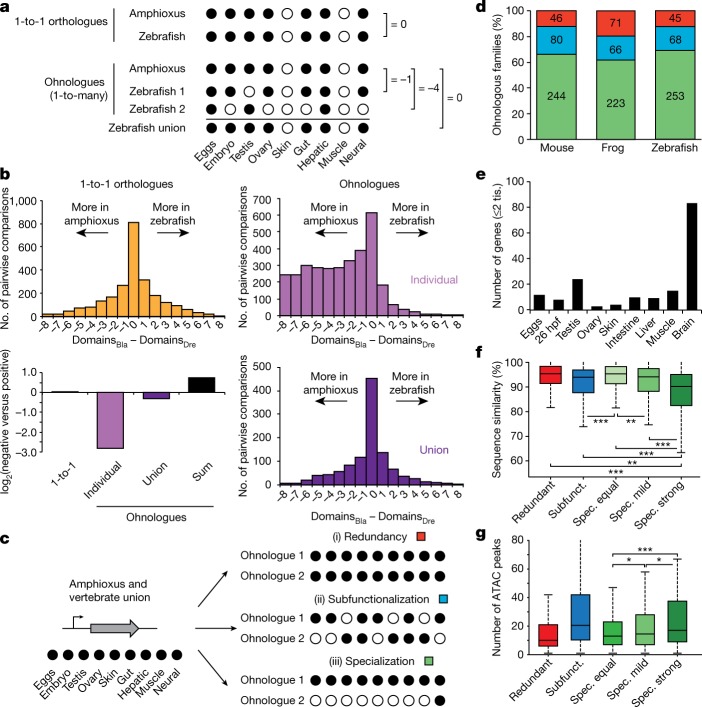
Fig. 6. Expression specialization is the main fate after WGD.
a, Schematic of the analysis shown in b. Expression is binarized for each gene across the nine homologous samples (‘on’, black dots; normalized cRPKM > 5). b, Distribution of the difference in positive domains between zebrafish (domainsDre) and amphioxus (domainsBla) for 1-to-1 orthologues (2,478 gene pairs; yellow), individual ohnologues (3,427 gene pairs in 1,135 families; lilac) and the union of all vertebrate ohnologues in a family (purple). Bottom left, log2 of the ratio between zebrafish genes with negative and positive score for each category. ‘Sum’ (black), binarization of family expression after summing the raw expression values for all ohnologues. c, Schematic of the analyses shown in d, representing the three possible fates after WGD. d, Distribution of fates after WGD for families of ohnologues. e, Number of ohnologues with strong specialization in zebrafish expressed in each domain. Tis., tissue. f, Distribution of the percentage of nucleotide sequence similarity between human and mouse by family type. Ohnologues from specialized families are divided into ‘spec. equal’ (which maintain all expression domains), ‘spec. mild’ (which have lost some but maintained more than two expression domains) and ‘spec. strong’ (≤2 expression domains remain). Subfunct., subfunctionalized. g, Distribution of the number of APREs within GREAT regions for zebrafish ohnologues for each category. Only statistical comparisons within specialized families are shown. P values in f and g correspond to two- and one-sided Wilcoxon sum-rank tests between the indicated groups, respectively. *0.05 > P value ≥ 0.01, ** 0.01 > P value ≥ 0.001, ***P value < 0.001. Exact P values and sample sizes are provided in Supplementary Data 2, dataset 8.

