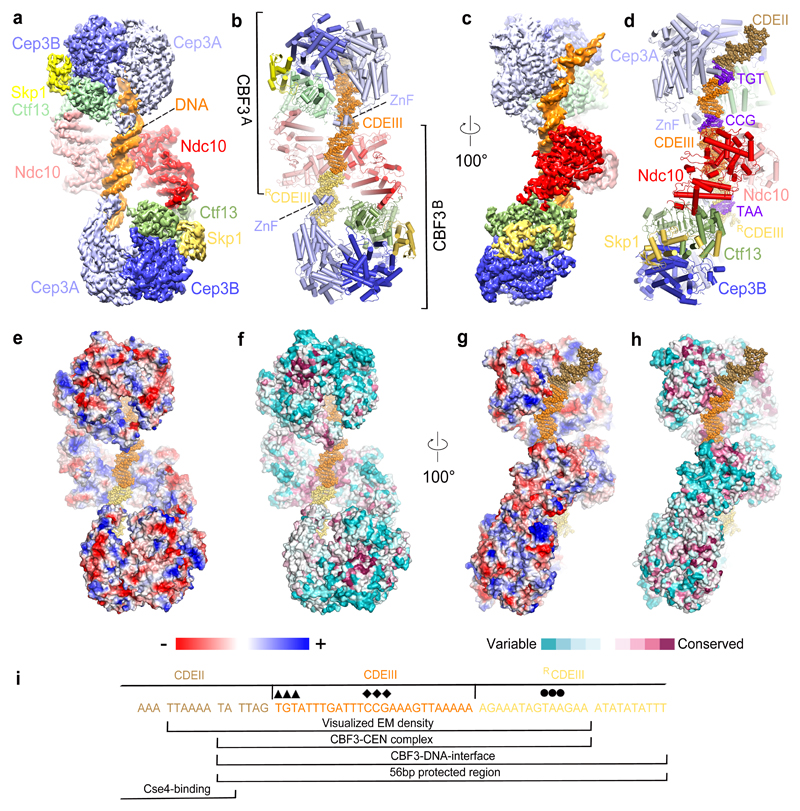
Figure 1. Overall structure of the dimeric−CEN3 complex.
(a) and (c) Two orthogonal views of the EM density map of the complex, (b) and (d) Corresponding cartoon representations. The TGT and CCG motifs of CDEIII are colored blue. (e) and (g) Electrostatic surface representation of the dimeric CBF3−CEN3 complex. Color code is displayed below. (f) and (h) Surface conservation of the CBF3−CEN3 dimer. Conservation score is indicated below. (i) Region of CEN3 sequence and 3’ flanking region recognized by the dimeric CBF3-CEN3 complex. Sequences indicated with diamonds and circles are the CCG and TAA motifs recognized by the Zn2Cys6 cluster of CBF3A and CBF3B, respectively. The TGT motif contacted by αMN helix of Cep3A is indicated with arrowheads.

