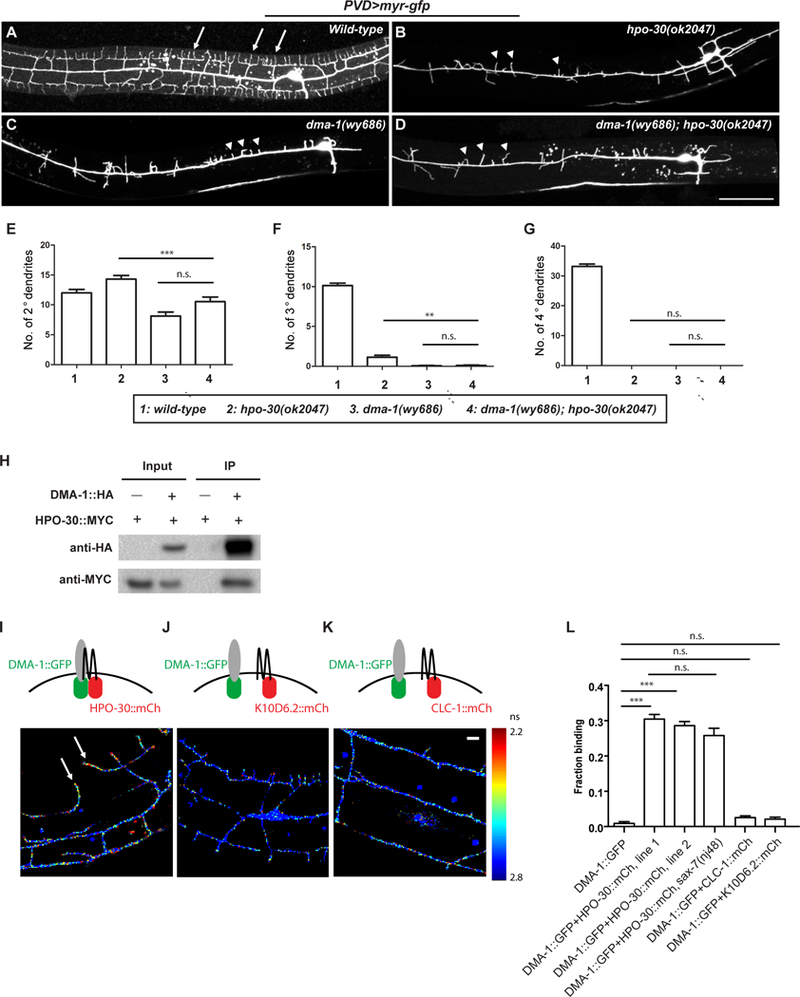
Figure 3. HPO-30 interacts with DMA-1 both in vivo and in vitro.

(A-D) Representative confocal images showing the morphologies of PVD dendritic arbors in animals of indicated genotypes. Arrows: 4o branches in the wild-type animals. Arrow heads: 2o branches that failed to form 4o or even 3o branches. Scale bar = 50 μm. (E-G) Quantification of the number of 2o, 3o and 4o branches in a region 100 μm anterior to the PVD cell body. Data were obtained using 20 animals for each genotype and are presented as mean ± SEM. One-sided ANOVA with Tukey test was used for statistical analysis. **: p<0.001. ***: p< 0.0001. n.s.: not significant. (H) Western blot of co-IP experiments. DMA-1-HA was used as the bait. (I-K) Fluorescence lifetime images of PVD neurons expressing DMA-1::GFPnovo2 with HPO-30::mCherry or with negative controls K10D6.2::mCherry or CLC-1::mCherry. Heat map represents measured fluorescence lifetime of DMA-1::GFPnovo2. Shorter life time (red signal) corresponds to higher FRET efficiency and stronger interaction. Arrows: DMA-1::GFPnovo2 co-expressed with HPO-30::mCherry exhibit short lifetime in 4o branches of wild-type PVD neurons. Scale bar = 10 μm. (L) Quantification of the images in (I-K), showing the fraction of DMA-1::GFPnovo2 bound to mCherry-tagged proteins. Data are represented as mean ± SEM, with 20 animals quantified for each genotype. ***: p< 0.001 by Student’s t-test. n.s.: not significant.
