
Fig. 3.
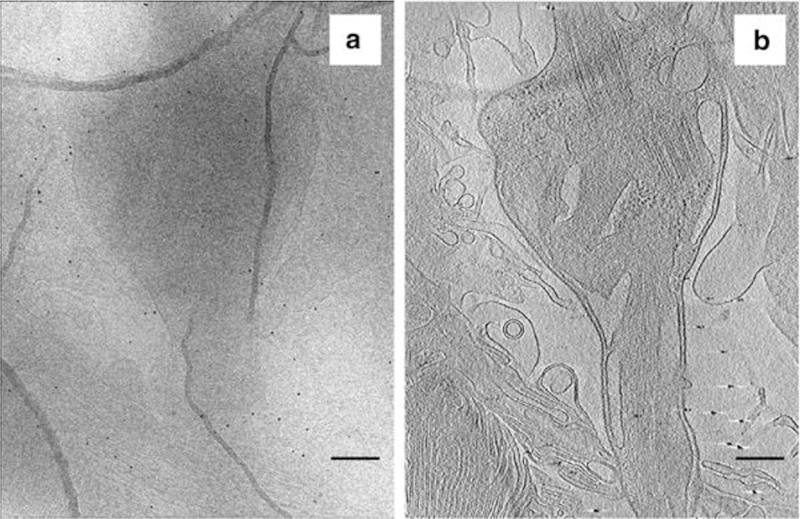
Single micrograph of a ROS taken during a tilt series. (a) Image corresponds to the 0° tilt angle. (b) Projection (6 nm thick) from a tomogram (same cell as in a) of the inner segment, containing the base of the connecting cilium and attached structures. This projection reveals the contrast gained from tomographic reconstruction of the tilt series micrographs. Scale bars = 300 nm