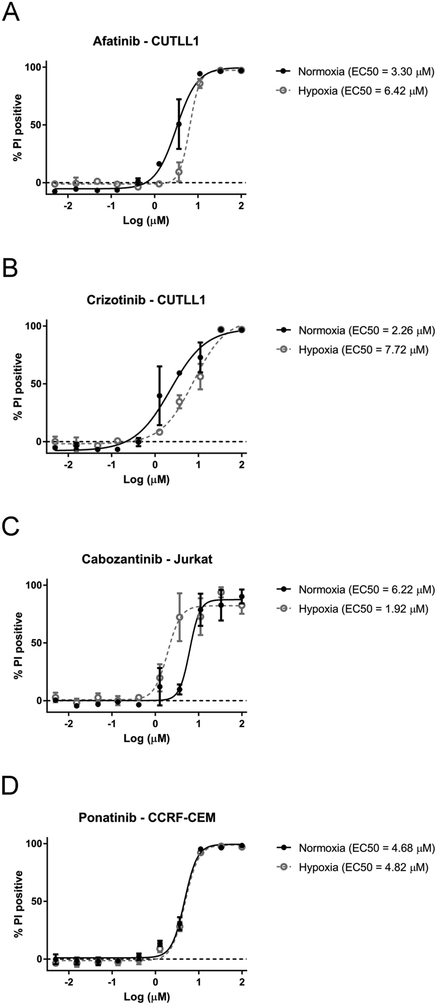
Figure 3.
Representative patterns of T-ALL sensitivity to kinase inhibitors in oxygen deprived environment: (A, B) resistance under hypoxia (HCR < 1). (C) sensitivity under hypoxia (HCR > 1). (D) equally sensitive under hypoxia and normoxia (HCR = 1). T-ALL cell lines were incubated with the tested drugs under hypoxic or normoxic conditions for 72 hr. Cell survival was determined using propidium iodide staining and HTFC. Each value represents the mean of three independent experiments. Error bars denote SEM.

