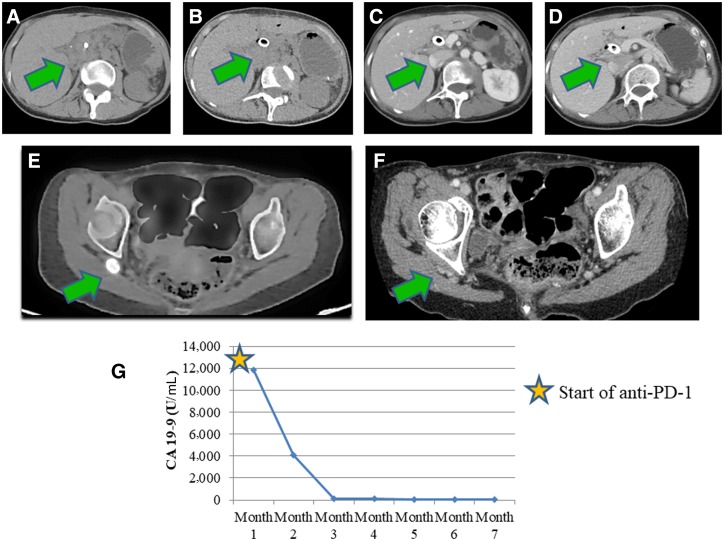
Figure 2.
Computed tomography (CT) of abdomen of patient 1 after treatment. (A–D): Interval resolution of pancreatic head mass. Positron emission tomography‐CT showing right gluteal mass (green arrow) with fluoro‐deoxyglucose avidity prior to treatment with immunotherapy (E) and after treatment with immunotherapy (F). (G): CA 19‐9 levels during treatment course with immunotherapy. Reference range for CA 19‐9 is <35 U/mL. Abbreviations: CA 19‐9, cancer antigen 19‐9; PD‐1, programmed cell death protein 1.

