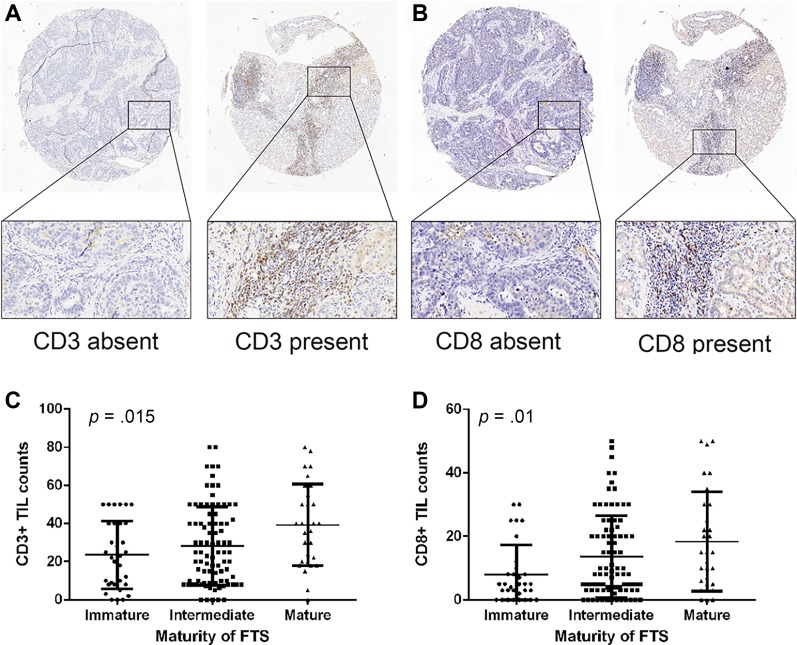
Figure 3.
Images of CD3‐ and CD8‐positive T cells and their infiltration patterns in patients with different maturity of FTS. Representative images of CD3 (A) and CD8 (B) immunohistochemistry staining (magnification ×50 for full views and ×200 for zoomed‐in views). The counts of CD3‐ (C) and CD8‐ (D) positive tumor‐infiltrating lymphocytes rose as the maturity of FTS increased. p values were generated by Kruskal‐Wallis test.
Abbreviations: FTS, fibrotic tumor stroma; TIL, tumor‐infiltrating lymphocyte.

