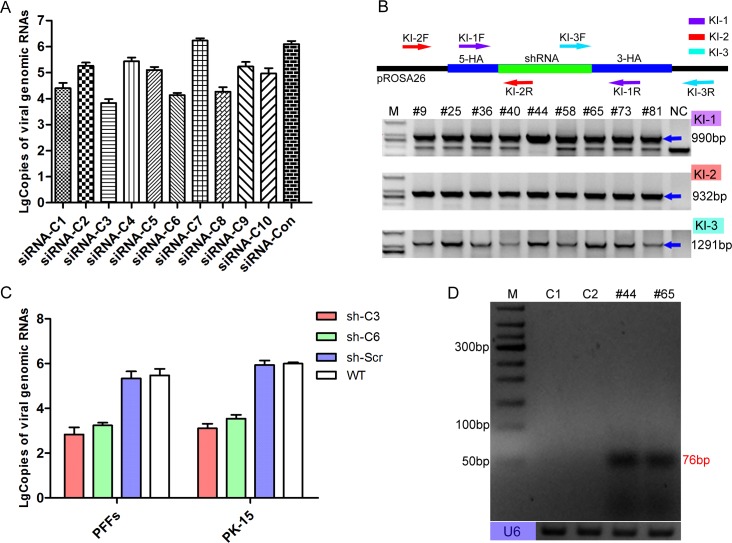
Fig 1. Selection of antiviral cell clones.
(A) Reduction of viral genome replication in siRNA-transfected cells was further assessed by real time PCR at 72 h post-infection. Error bars represent the SEMs, n = 3. (B) Genomic PCR analysis confirmed the knock-in events at the pRosa26 locus by using specific primers (Table 4). The KI-1 primers were used to determine homozygosity or heterozygosity, the KI-2 primers amplified the 5’ junction, and the KI-3 primers amplified the 3’ junction junction. The blue arrows indicate target amplicons, and the corresponding sizes of the PCR amplicons are 990, 932 and 1291 bp. Lanes 2–10 represent the positive shRNA knock-in PFF clones. NC: negative control (wild-type PFFs). M: D2000. The corresponding sequences of these primers are listed in Table 4. (C) Inhibition of viable viral production in shRNA knock-in cell clones (PFF and PK-15 cell clones) was further assessed by real-time PCR at 72 h post-infection. The copies of the viral genomes were analysed using the unpaired t-test. Error bars represent the SEMs, n = 3. Sh-C3: sh-C3 knock-in cell clone. Sh-C6: sh-C6 knock-in cell clone. Sh-Scr: scrambled shRNA knock-in cell clone. WT: wild-type PFFs. (D) Expression of the two targeting siRNAs in the corresponding transgenic PFF clones was confirmed by RT-PCR. M: 50bp DNA ladder. C1: wild-type PFFs. C2: scrambled shRNA transgenic PFF clones. #44: shRNA-C3 transgenic PFF clones. #65: shRNA-C6 transgenic PFF clones. The size of the target amplicons was 76 bp. Endogenous U6 was used as an RNA quality and loading control.

