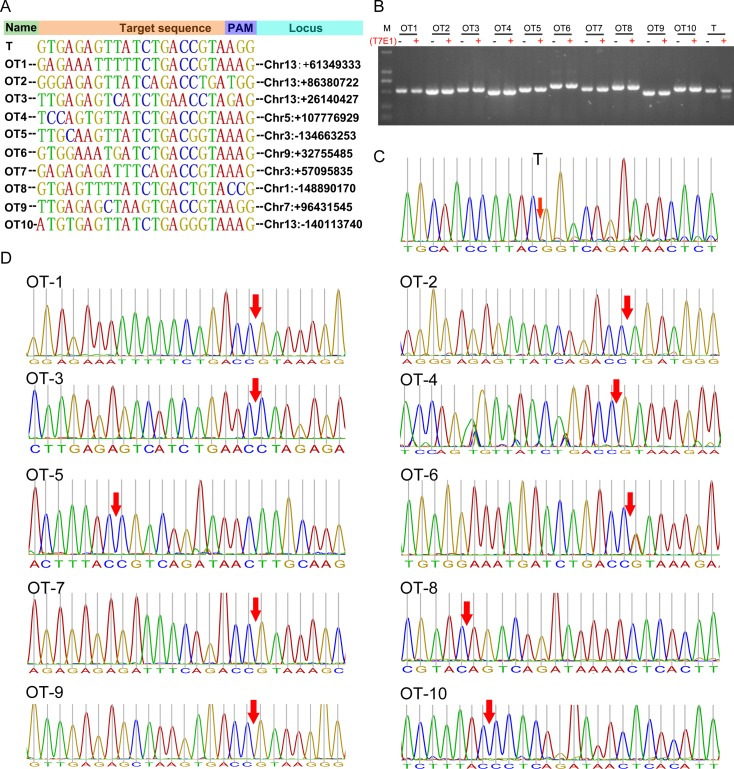
Fig 3. Off-target site analysis.
(A) The target site (T) and ten predicted off-target sites (OT) for sgRNA91/Cas9. OT1~OT10 represents 10 potential off-target sites, and T represents target site. (B) T7E1 cleavage assays for the target site and the ten potential off-target sites; M, DL2000; (C) Sanger sequencing analyses of PCR amplicons that spanning the target sites. The cleavage sites are labeled with red arrow. (D) Sanger sequencing analyses of PCR amplicons that spanning the potential off-target sites. The potential cleavage sites are labeled with red arrow.

