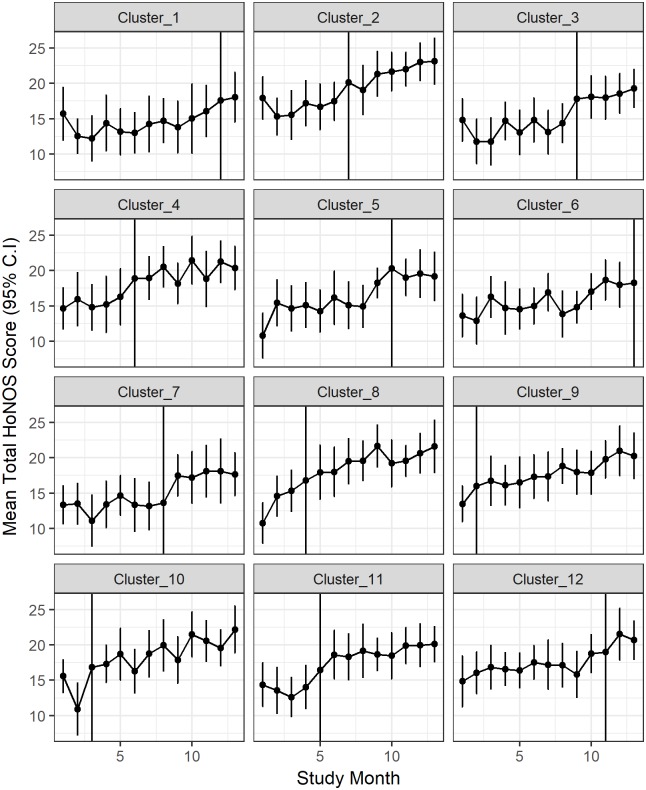
Fig 4. The simulated data under scenario D17: yik(t) = 14 + 2xtk + 0.25t + 0.25dtk.
The means and 95% confidence intervals are plotted against the time since the intervention was introduced. Data to the left of the vertical line occurred before the intervention and data to the right after the intervention was introduced.

