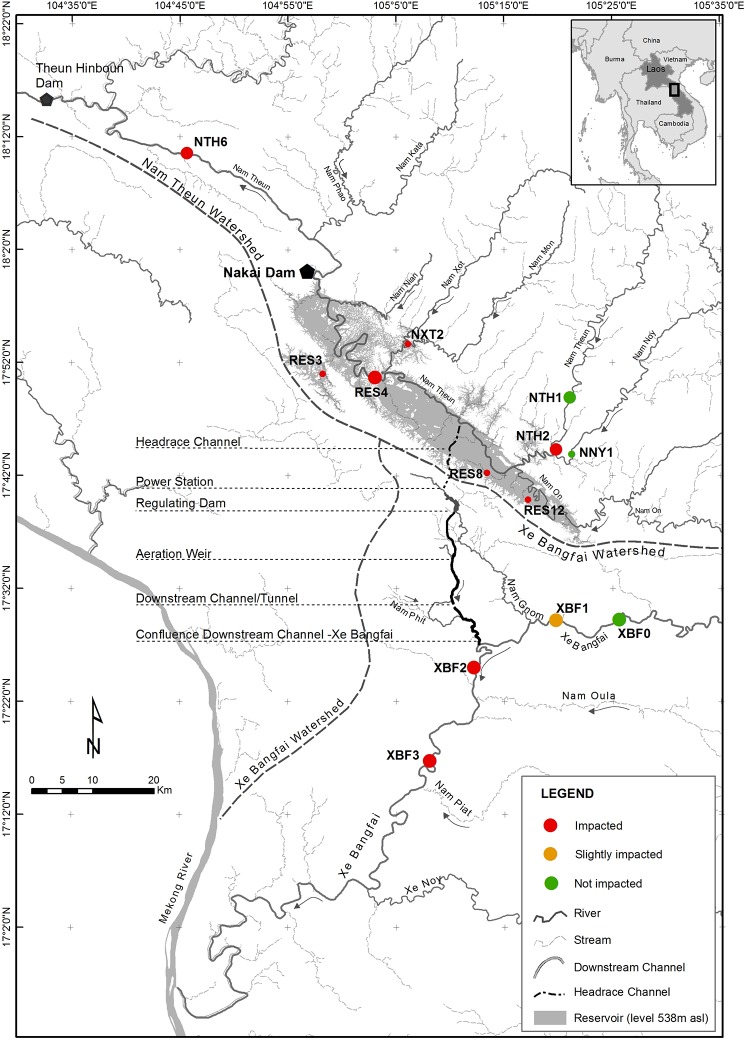
Fig 1. The Nam Theun 2 area with the location of the Nakai dam and the sampling sites used in the study (dots).
The dots are colored according to their status: affected, slightly affected or not affected by the dam in terms of water quality features, backwaters, reservoir and fluctuation levels or river flow. The larger dots correspond to the sites sampled for eDNA metabarcoding monitoring (see text and S1 Table for geographic coordinates).

