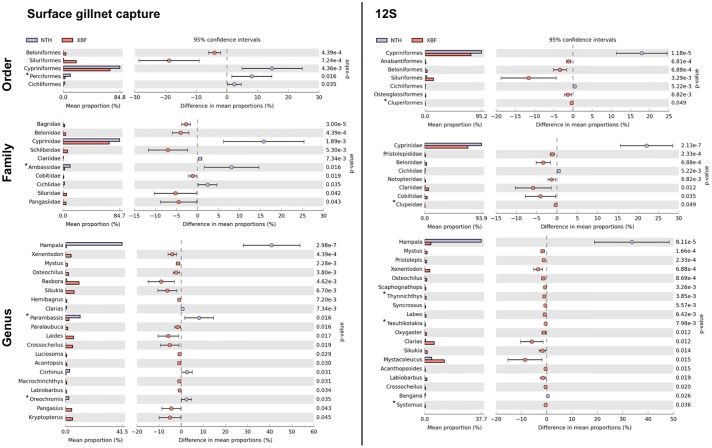
Fig 3. Taxonomic groups showing significant differences (p<0.05) in estimated mean proportions observed between NTH and XBF either by (A) surface gillnet capture or by (B) eDNA approach (12S) during the entire survey.
Order, family and genus levels are detailed. Stars indicate groups that are detected by only one method.

