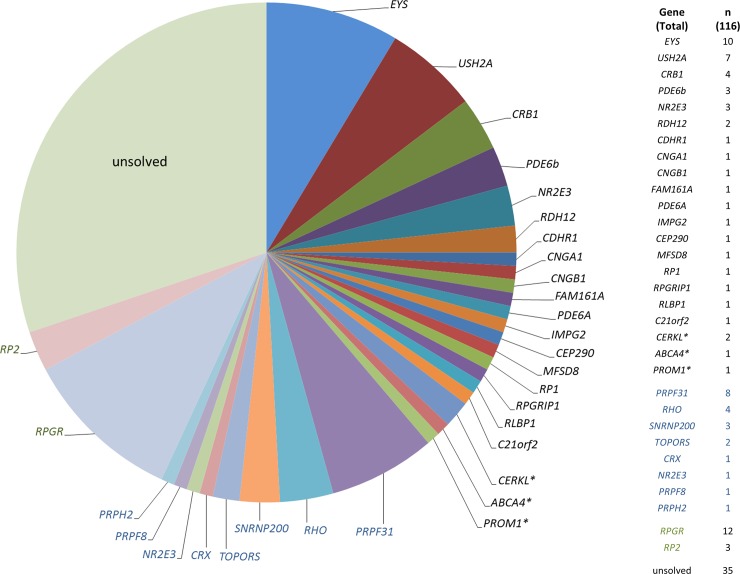
Fig 1. Distribution of mutations in consecutive, unrelated RP patients.
Genes mutated in patients who were reversely phenotyped (based on the genetic findings) are indicated by asterisk. The number of patients with mutations in the different genes is displayed on the right. Black, autosomal recessive. Blue, autosomal dominant. Green, X-linked.

