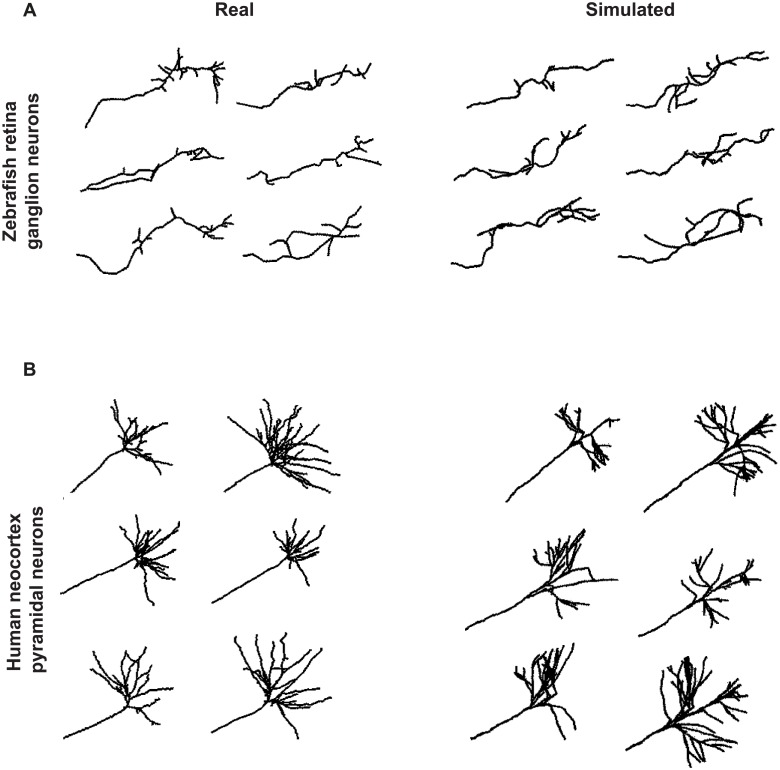
Fig 2. Examples of axonal morphologies generated by the model and comparison to real data.
(A) Real (left) and simulated (right) axonal trees of zebrafish retina ganglion neurons. (B) Real (left) and simulated (right) axonal trees of human neocortex pyramidal neurons. Real axonal trees were obtained from the Neuromorpho.org database. Simulated axons where generated in isolation, using the following parameter values (Zebrafish/Human): for the main axon α = 15/10 and β = 2/30; for the branches α = 20/100 and β = 0.5/10, Δρ = 1/3, ψ = 0 rad ∀x / 0 rad. for x ≤ 60 μm, +(−)1.3 rad for x > 60 μm and y > 0(y ≤ 0), Pb = 0.5/0 for x < 60 μm and 0.3 otherwise, ω: uniform in all the space/ uniform in a solid angle of respect to the neurite from which the branch emerges, λb = 6/1, bl = 2/2, nmax = 10/1, Xmax = 80/110. In addition, for the human neocortex pyramidal neurons, branch maximum lengths follow a normal distribution of mean 100 μm and standard deviation 70 μm.

