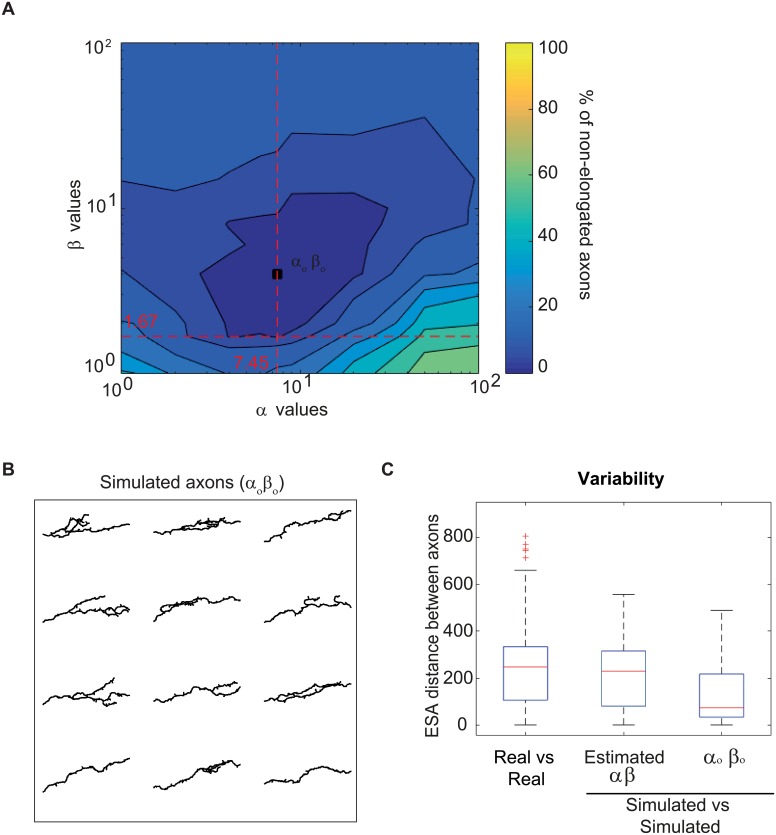
Fig 7. Impact of α and β values on axon morphologies.
(A) Percentage of axons failing to reach the lobe extremity in function of pairs of parameter values. The dotted lines correspond to the parameter values estimated from data (see Parameter Estimation). The square shows the pair of parameter values minimizing the percentage of axons that do not reach the lobe extremity (αo and βo). (B) Examples of γ axon morphologies from simulations with the parameters that optimize axon growth at the population level (αo βo). (C) Boxplots of inter-axon distances within the population of real axons (real, n = 43), axons simulated with the estimated parameters (estimated α β, n = 50), and axons simulated with the αo βo parameters (n = 50). Inter-axon distances were calculated with the ESA distance [40]. Boxplots were created following the original plotting convention of Tukey. The central mark indicates the median, the bottom and top edges of the box indicate the 25th and 75th percentiles, respectively. The whiskers extend to the most extreme data points not considered as outliers. Outliers are plotted individually using the ‘+’ symbol.

