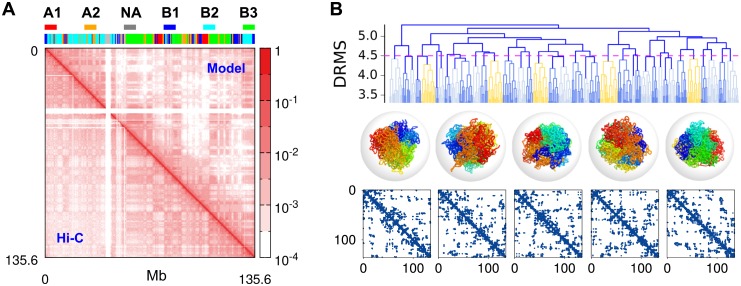
Fig 1. Conformational ensemble of chromosome 10 of human B-lymphoblastoid cells generated from simulations.
(A) The contact frequency map from the ensemble of structures generated using MiChroM (upper right corner) generates the overall checkerboard pattern of Hi-C map (lower left corner). The 6 subcompartment types assigned to chromosome loci are depicted on the top. (B) The dendrogram represents the outcome of hierarchical clustering of the ensemble of structures obtained from conformational sampling. Each terminal branch at DRMS = 3.3 a represents the ensemble of structures that can be clustered with the condition of DRMS < 3.3 a. The distance (DRMS) between the two distinct structures k and l is given by (Eq 1), and the distance between two clusters K and L is defined as the maximum distance between two conformations, each belonging to the two clusters, i.e., . Among the clusters whose inter-cluster distance is smaller than , the centroid structures (kc ∈ K), which minimize , are depicted in rainbow coloring scheme. As suggested by the contact map of each chromosome structure shown at the bottom, the centroid structure of each cluster is distinct from each other. We have selected these five structures as the initial conformations for generating trajectories for dynamic simulations of chromosomes.

