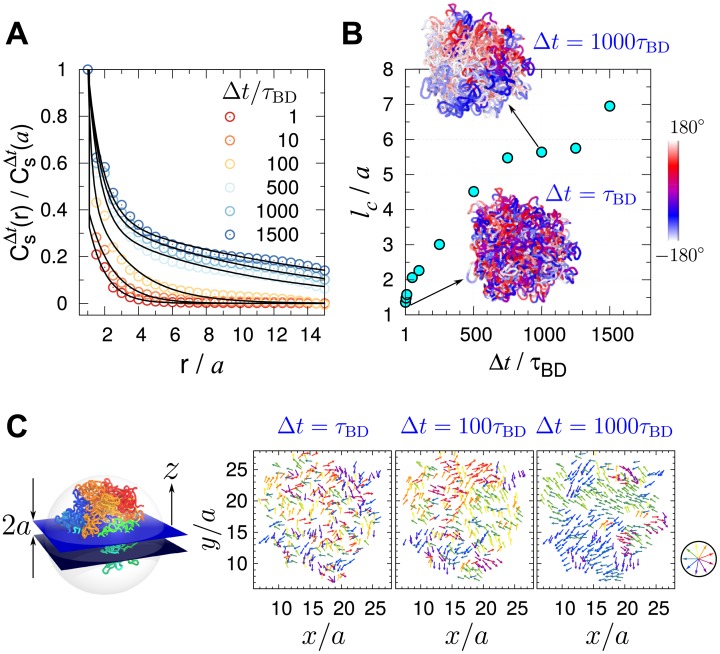
Fig 3. Spatial correlation between loci displacements.
(A) Spatial correlation of loci displacements (Eq 4) with varying lag time (Δt). (B) Correlation length as a function of Δt. Visualized on 3D chromosome structure are the displacement correlations of chromatin loci probed at short and large time gap (Δt = τBD and 103 τBD) projected onto the xy-plane. The color-code on the structures depicts the azimuthal angle of loci displacement. (C) The displacement vector of loci in the equator plane are color-coded by direction. In each panel, the displacement vectors are calculated for Δt = 1, 100, 1000 τBD. Direction-dependent color scheme is depicted on the right.

