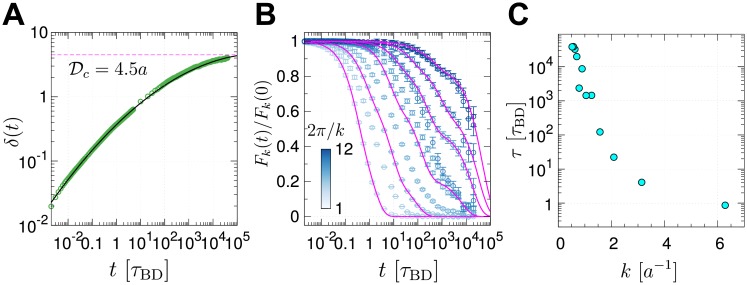
Fig 5. Relaxation times of chain conformations.
(A) Time evolution of the root mean square distance between a pair of loci ri,j(t) at time t relative to its initial value (ri,j(0)) averaged over all pairs, defined by δ(t) = [2∑i>j(ri,j(t) − ri,j(0))2/N(N − 1)]1/2. (B) Normalized intermediate scattering function Fk(t)/Fk(0), with different values of wave number k, were calculated from BD simulation trajectories of the chromosome. (C) The chain relaxation time (τ) for different wave number k was estimated by evaluating .

