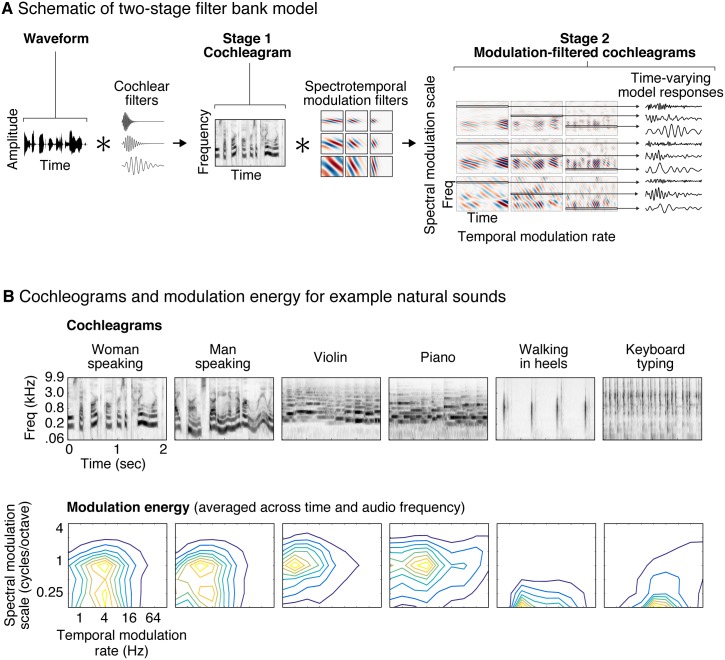
Fig 1. Illustration of the auditory model tested in this study.
(A) The model consists of two cascaded stages of filtering. In the first stage, a cochleagram is computed by convolving each sound with audio filters tuned to different frequencies, extracting the temporal envelope of the resulting filter responses, and applying a compressive nonlinearity to simulate the effect of cochlear amplification (for simplicity, envelope extraction and compression are not illustrated in the figure). The result is a spectrogram-like structure that represents sound energy as a function of time and frequency. In the second stage, the cochleagram is convolved in time and frequency with filters that are tuned to different rates of temporal and spectral modulation. The output of the second stage can be conceptualized as a set of filtered cochleagrams, each highlighting modulations at a particular temporal rate and spectral scale. Each frequency channel of these filtered cochleagrams represents the time-varying output of a single model feature that is tuned to audio frequency, temporal modulation rate, and spectral modulation scale. (B) Cochleagrams and modulation spectra are shown for six example natural sounds. Modulation spectra plot the energy (variance) of the second-stage filter responses as a function of temporal modulation rate and spectral modulation scale, averaged across time and audio frequency. Different classes of sounds have characteristic modulation spectra.

