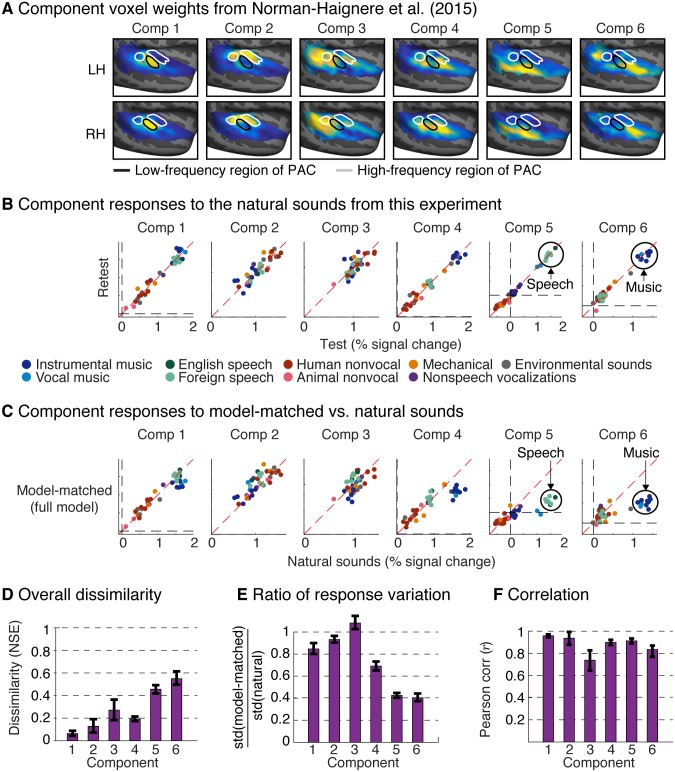
Fig 6. Voxel decomposition of responses to natural and model-matched sounds.
Previously, we found that much of the voxel response variance to natural sounds can be approximated as a weighted sum of six canonical response patterns (“components”) [45]. This figure shows the response of these components to the natural and model-matched sounds from this experiment. (A) The group component weights from Norman-Haignere and colleagues (2015) [45] are replotted to show where in auditory cortex each component explains the neural response. (B) Test-retest reliability of component responses to the natural sounds from this study. Each data point represents responses to a single sound, with color denoting its semantic category. Components 5 and 6 showed selectivity for speech and music, respectively, as expected (Component 4 also responded most to music because of its selectivity for sounds with pitch). (C) Component responses to natural and model-matched sounds constrained by the complete spectrotemporal model (see S11 Fig for results using subsets of model features). The speech and music-selective components show a weak response to model-matched sounds, even for sounds constrained by the full model. (D) NSE between responses to natural and model-matched sounds for each component. (E) The ratio of the standard deviation of each component’s responses to model-matched and natural sounds (see S12A Fig for corresponding whole-brain maps). (F) Pearson correlation of responses to natural and model-matched sounds (see S12B Fig for corresponding whole-brain maps). All of the metrics in panels D—F are noise-corrected, although the effect of this correction is modest because the component responses are reliable (as is evident in panel B). Error bars correspond to one standard error computed via bootstrapping across subjects. LH, left hemisphere; NSE, normalized squared error; PAC, primary auditory cortex; RH, right hemisphere.

