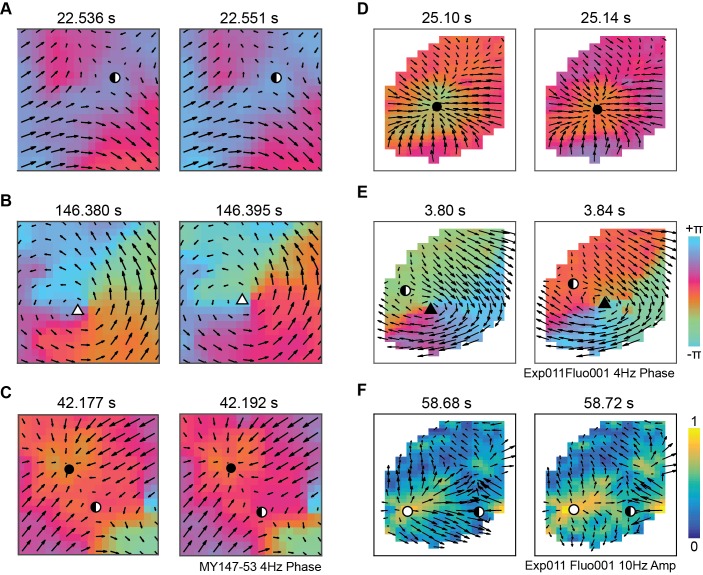
Fig 4. Complex wave patterns in marmoset area MT and mouse cortex.
A, B, C, Complex wave patterns in phase maps of 4 Hz LFP oscillations during ongoing activity recorded from marmoset area MT. Velocity vector fields (black arrows) were calculated between consecutive phase maps separated by 1 ms; we use larger time gaps between snapshots here to show wave propagation more clearly. Critical points are indicated by symbols corresponding to the classes in Fig 1. D, E, Complex wave patterns in phase maps of 4 Hz optical voltage imaging oscillations in awake mouse cortex. Velocity vector fields are calculated from phase maps separated by 20 ms. F, Localized propagating activity in amplitude maps of 10 Hz optical voltage imaging oscillations in awake mouse cortex.

