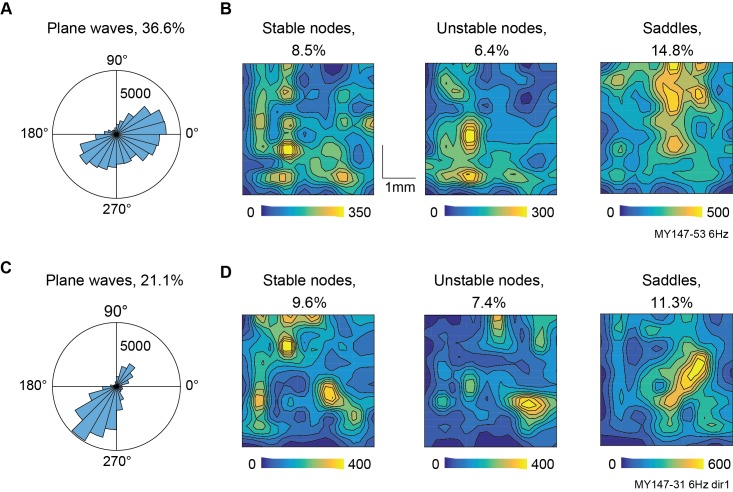
Fig 6. Distributions of plane wave propagation direction and complex pattern center location in ongoing and stimulus-evoked PVFs.
A, Histogram of plane wave propagation direction in 6 Hz phase of ongoing activity. Also shown is the percentage of time across the recording in which plane wave activity occurred. B, Spatial distribution within the recording array of critical points across all occurrences of node and saddle patterns. Note that foci have been combined with nodes for this analysis. C, D, Same as A, B, but for a recording visually evoked by moving dot fields.

