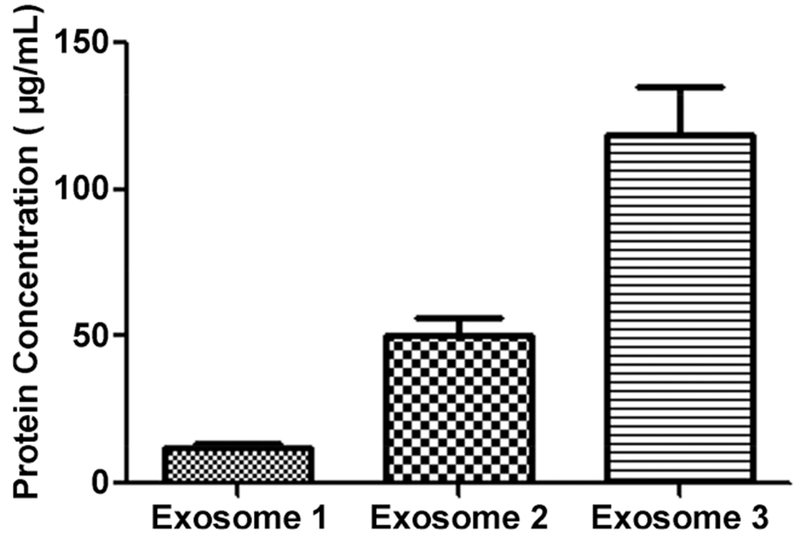
Figure 2.

Protein concentration of fractions 8, 9, and 10 eluted from SEC column. In the SEC method, 0.5 mL of diluted serum was loaded onto the SEC column. The eluent was collected by fractions, where each fraction was 0.5 mL. The protein amount of each fraction was then measured using the BCA assay three times, and it was found that the ninth and tenth fractions had a much higher protein amount compared with the eighth.
