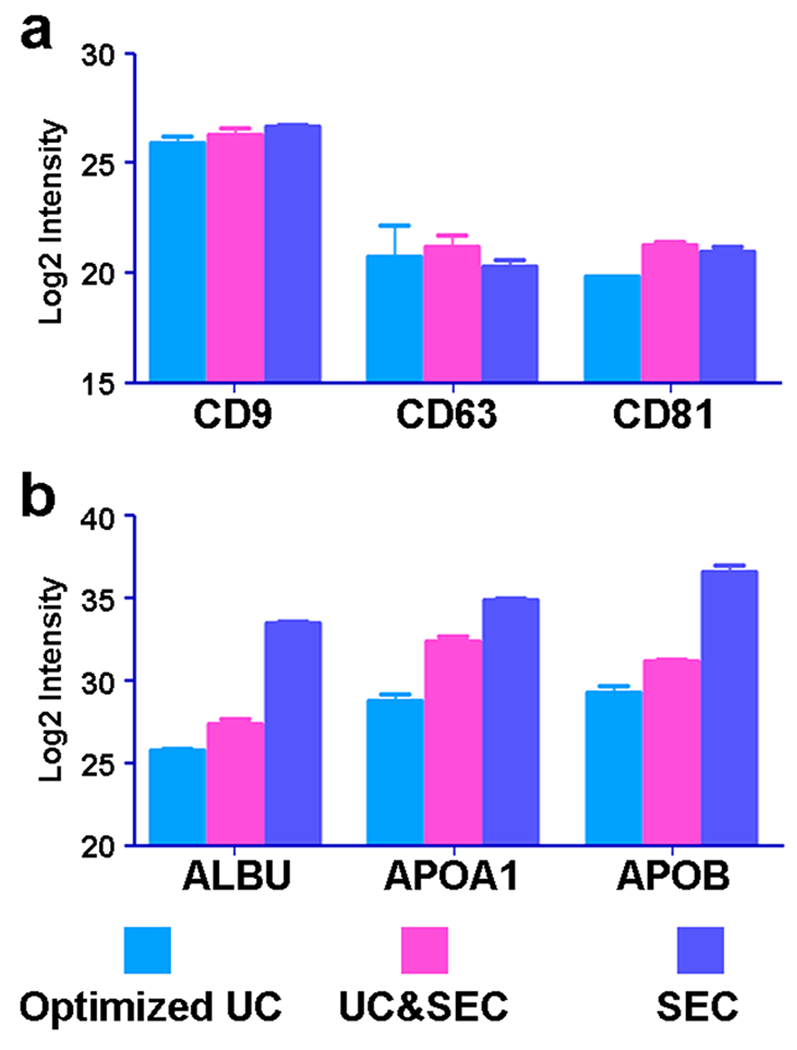
Figure 5.

Relative abundance of exosome markers and serum contamination protein in the samples from the three methods. (a) Relative abundance of three exosome markers (CD9, CD63, and CD81) identified in the samples from the three methods was similar. The protein amounts of CD9, CD63, and CD81 in samples from the UC&SEC column method are 1.3, 1.4, and 2.7 times that of the optimized UC method, respectively. (b) Protein amounts of ALBU, APOA1, and APOB in samples from the SEC column method are 149.2, 38.6, and 127.5 times of that of the optimized UC method, respectively.
