. 2018 Dec 3;7:e39981. doi: 10.7554/eLife.39981

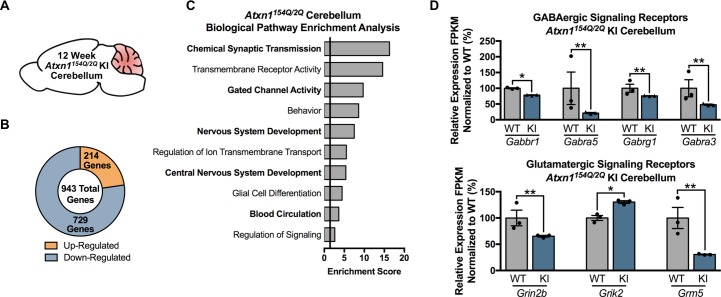
Figure 3. Chemical Synaptic Transmission genes, including GABAergic and glutamatergic genes, are differentially regulated in the 12 week old Atxn1154Q/2Q KI cerebellum.

(A) Illustration of the tissue examined. (B) Total number of up- and down-regulated genes in the 12 week old Atxn1154Q/2Q KI cerebellum (FDR p-value < 0.05; n = 3 males per genotype for RNA-seq). (C) Biological pathway enrichment for all differentially regulated cerebellar genes. (D) GABAergic and glutamatergic receptors and receptor subunits are altered in the cerebellum (* FDR p-value < 0.05; ** FDR p-value < 0.01; n = 3 males per group).

Figure 3—source data 1. 5 week old Atxn1154Q/2Q KI cerebellum functional annotation clustering (differentially expressed genes FDR p-value < 0.05).
DOI: 10.7554/eLife.39981.019
Figure 3—source data 2. 12 week old Atxn1154Q/2Q KI cerebellum functional annotation enrichment analysis.
DOI: 10.7554/eLife.39981.020
Figure 3—source data 3. 5 week old Atxn1154Q/2Q KI cerebellum functional annotation enrichment analysis (using nominal p-value < 0.01 for genes).
DOI: 10.7554/eLife.39981.021
Figure 3—source data 4. Atxn1154Q/2Q KI Cerebellum 5 weeks enrichment chart edited for EnrichmentMap (nominal p-value < 0.01).
DOI: 10.7554/eLife.39981.022
Figure 3—source data 5. 12 week old Atxn1154Q/2Q KI cerebellum enrichment chart edited for EnrichmentMap (FDR p-value < 0.05).
DOI: 10.7554/eLife.39981.023

Figure 3.

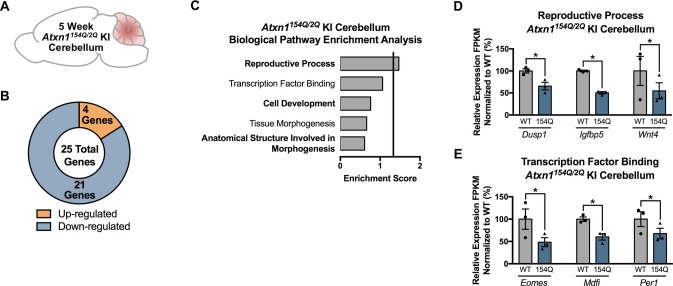
Figure 3—figure supplement 1. Few genes and pathways are significantly enriched in the 5 week Atxn1154Q/2Q KI cerebellum.

Figure 3—figure supplement 1.

(A) Illustration of the tissue examined. (B) Total number of up- and down-regulated genes in Atxn1154Q/2Q KI cerebellum at 5 weeks of age (FDR p-value < 0.05; n = 3 males per genotype for RNA-seq). (C) Biological pathway enrichment for all differentially regulated genes in the 5 week old Atxn1154Q/2Q KI cerebellum. (D) Reproductive Process and (E) Transcription Factor Binding-related genes are largely down-regulated in the 5 week Atxn1154Q/2Q KI cerebellum. * FDR p-value < 0.05 (n = 3 males per genotype used in RNA-seq).
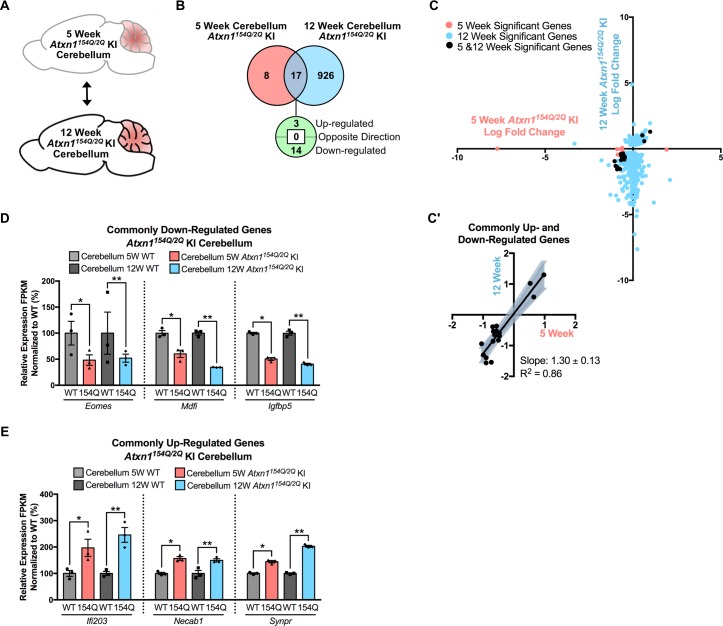
Figure 3—figure supplement 2. Consistent gene expression changes in the Atxn1154Q/2Q KI cerebellum across the 5 and 12 week time-points.

Figure 3—figure supplement 2.

(A) Schematic of the time-point comparison in Atxn1154Q/2Q KI cerebellum. (B) Total number of differentially regulated genes in the Atxn1154Q/2Q KI cerebellum that are commonly altered in both the 5 and 12 week time-point relative to appropriate WT controls (FDR p-value < 0.05; n = 3 males per genotype for RNA-seq). (C) Dot plot of log fold changes for genes altered in the 5 and 12 week Atxn1154Q/2Q KI cerebellum. (C') Log fold change of genes up- or down-regulated at both the 5 week and 12 week time-points only. Linear regression analysis identified the slope and R2 of these log fold changes (slope = 1.30 ± 0.13; R2 = 0.86). A total of 17 genes were plotted in this analysis. (D) A subset of genes were commonly down-regulated and (E) commonly up-regulated at both time-points. * FDR p-value < 0.05; ** FDR p-value < 0.01 (n = 3 males per genotype for each time-point).
Figure 3—figure supplement 3. Nominally significant differentially regulated genes in the 5 week old Atxn1154Q/2Q KI cerebellum overlapped with previously published microarray datasets and revealed significantly enriched pathways.

Figure 3—figure supplement 3.

(A) Subset of genes with a nominal p-value < 0.01 that overlapped with a previously published dataset (* nominal p-value < 0.01 but FDR p-value > 0.05; n = 3 males per genotype used in RNA-seq). (B) Total number of up- and down-regulated genes in Atxn1154Q/2Q KI cerebellum at 5 weeks of age (p-value < 0.01; n = 3 males per genotype for RNA-seq). (C) Biological pathway enrichment for all differentially regulated cerebellum genes with a nominal p-value < 0.01.
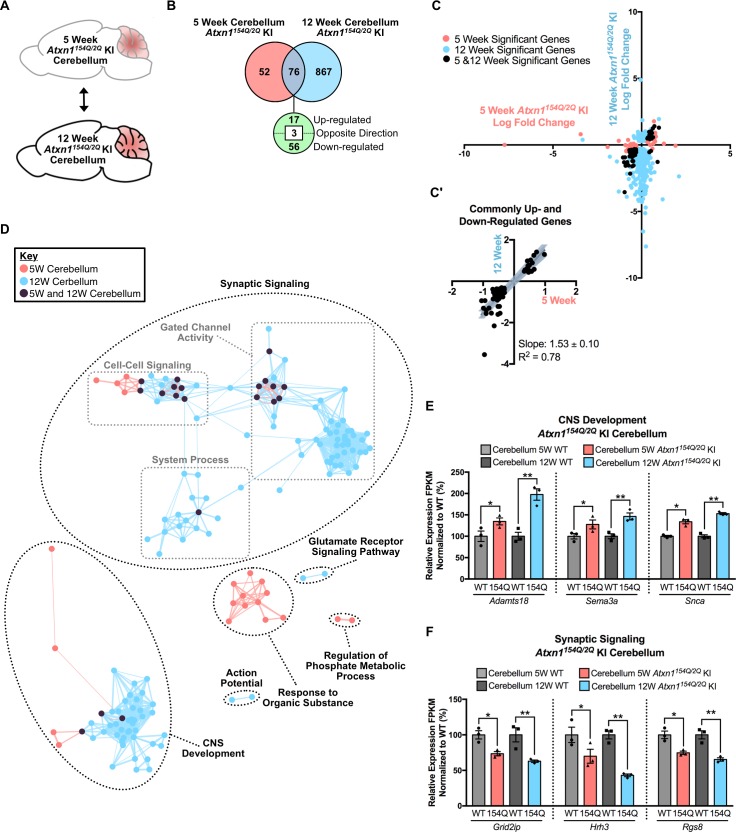
Figure 3—figure supplement 4. Consistent gene expression changes and pathway enrichment in the 5 week and 12 week Atxn1154Q/2Q KI cerebellum with an expanded 5 week p-value cutoff.

Figure 3—figure supplement 4.

(A) Schematic of the time-point comparison in Atxn1154Q/2Q KI cerebellum. (B) Total number of differentially regulated genes in the Atxn1154Q/2Q KI cerebellum relative to appropriate WT controls that are common, and uniquely altered, in each time-point (nominal p-value < 0.01 for 5 week dataset; FDR p-value < 0.05 for 12 week dataset; n = 3 males per genotype for each time-point for RNA-seq). (C) Dot plot of log fold changes for genes altered in the 5 and 12 week Atxn1154Q/2Q KI cerebellum. Nominal p < 0.01 for the 5 week dataset, FDR p-value < 0.05 for the 12 week dataset. (C') Log fold change of genes up- or down-regulated in both the 5 week and 12 week time-points only. Dysregulated gene were excluded from this analysis. Linear regression analysis identified the slope and R2 of these log fold changes (slope = 1.53 ± 0.10; R2 = 0.78). A total of 73 genes were plotted in this analysis. (D) Clustering of GO terms identified from the Atxn1154Q/2Q KI cerebellum 5 week and 12 week differentially regulated gene lists relative to the appropriate WT controls. For this analysis, genes with a nominal p-value < 0.01 were used to generate the GO list for the 5 week Atxn1154Q/2Q KI cerebellum, and FDR p-value < 0.05 was used for the 12 week cerebellum. (E) A subset of genes associated with CNS Development were commonly up-regulated and (F) a subset of Synaptic Signaling genes were commonly down-regulated when assessed in the 5 and 12 week time-point. * nominal p-value < 0.01; ** FDR p-value < 0.01 (n = 3 males per genotype for each time-point).