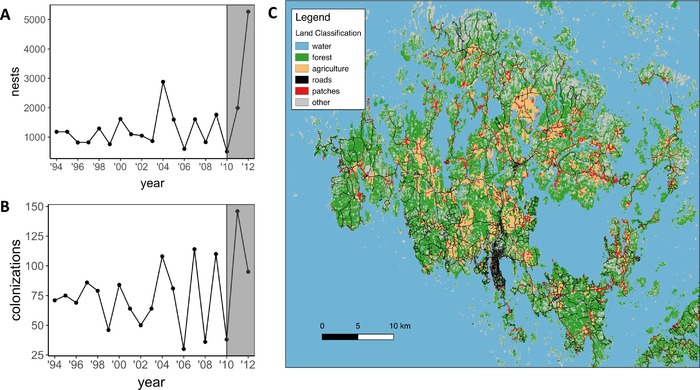
Figure 1.

Yearly variation in the number of nests (A) and colonizations (B) in the Åland Islands (C). The period of study from 2010 to 2012 is highlighted in (A) and (B), and (C) shows the major land cover types across the study region. Data for population trends come from annual surveys described in detail in Ojanen et al. 2013.
