
Figure 3.
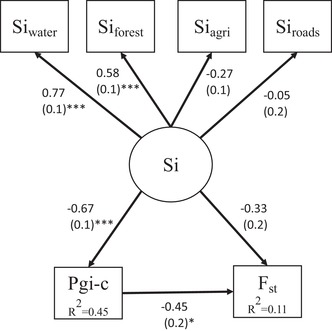
Results from a structural equation model test for direct and indirect effects of patch connectivity (Si) on genetic structure (Fst) for new populations in 2011. Arrows show tested unidirectional relationship among variables. Connectivity (Si) was included as a latent variable described by four observed indicator variables, Siwater, Siforest, Siagriculture, and Siroads. Standardized coefficients and associated standard errors are shown beside their respective paths, and significant paths are marked with asterisks. Variance explained is shown in the boxes of the endogenous variables, Pgi‐c and Fst