
Figure 3.
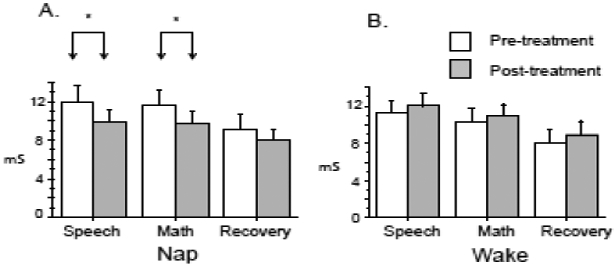
Skin conductance level during Performance (Speech, Math) and Recovery phases. Nap arm, N=15, Wake Arm N= 12, Error bars represent standard error of the mean. mS – microSiemens, * p < 0.05.
Official websites use .gov
A
.gov website belongs to an official
government organization in the United States.
Secure .gov websites use HTTPS
A lock (
) or https:// means you've safely
connected to the .gov website. Share sensitive
information only on official, secure websites.
Skin conductance level during Performance (Speech, Math) and Recovery phases. Nap arm, N=15, Wake Arm N= 12, Error bars represent standard error of the mean. mS – microSiemens, * p < 0.05.