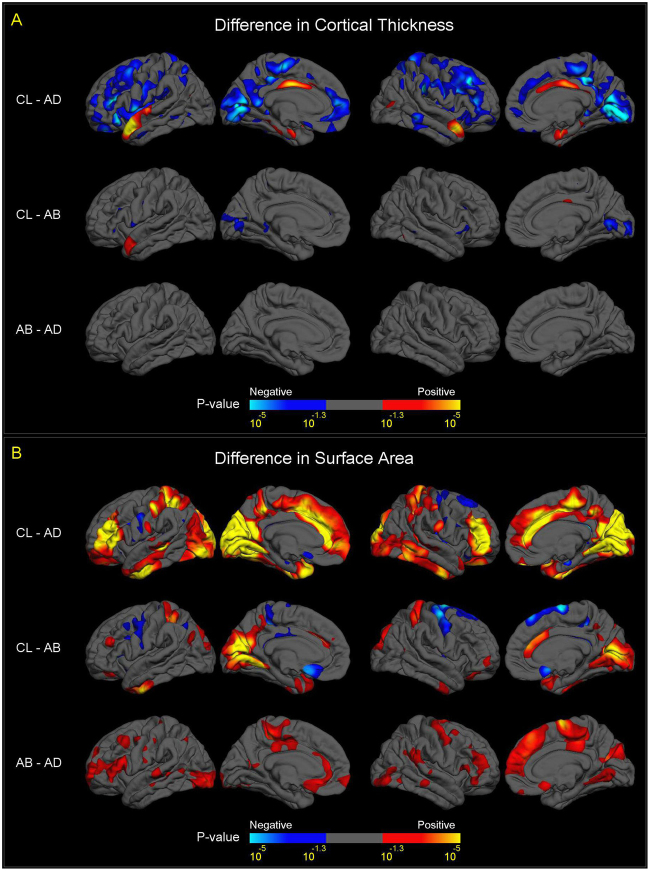
Fig. 4.
Vertex-wise mapping of differences in CT and SA, between A–B, A–D Deletion, and Control Subjects. For all figures, colored areas show p-values of group difference that remain significant after FDR correction (q = 0.05) for all vertices across both left and right cortical surfaces. The positive and negative directions in the color-bars indicate the signs of differences after subtracting one group from another labelled on the left side. a Differences in CT between A–B deletion, A–D deletion and control subjects. Compared to controls, subjects with A–B deletions showed thicker cortex (in blue colors) in bilateral pericalcarine cortex and bilateral inferior frontal gyrus, and thinner cortex (in red-yellow colors) in the left anterior superior temporal gyrus and right posterior cingulate cortex. Subjects with A–B deletions showed no significant difference in CT in any cortical region. The comparison of CT between subjects with A–D deletions and controls showed a similar pattern of group differences to the overall 22q11DS case-control analysis (Fig. 1a), although effects were diminished. b Difference in SA between A–B deletion, A–D deletion, and control subjects. Compared to controls, subjects with A–B deletions showed significantly reduced SA (in red-yellow colors), more prominent in the posterior portion of the medial and inferior cortical surface, including the bilateral cuneus, precuneus, pericalcarine, lingual, fusiform, and inferior temporal regions, and caudal anterior cingulate. Increased SA in A–B deletion cases vs. controls was observed in bilateral precentral, paracentral, and medial orbitofrontal regions (in blue colors). Compared to subjects with A–B deletions, subjects with A–D deletions showed widespread significant cortical SA reductions (in red-yellow colors), most prominently in the anterior portion of the medial cortical surface, including the paracentral lobules, cingulate, precentral, superior frontal regions, and widely distributed lateral cortical regions. Like CT, the comparisons of SA between subjects with A–D deletions and controls showed a similar pattern of group differences to the overall 22q11DS case-control analysis (Fig. 1b), although effects were diminished

