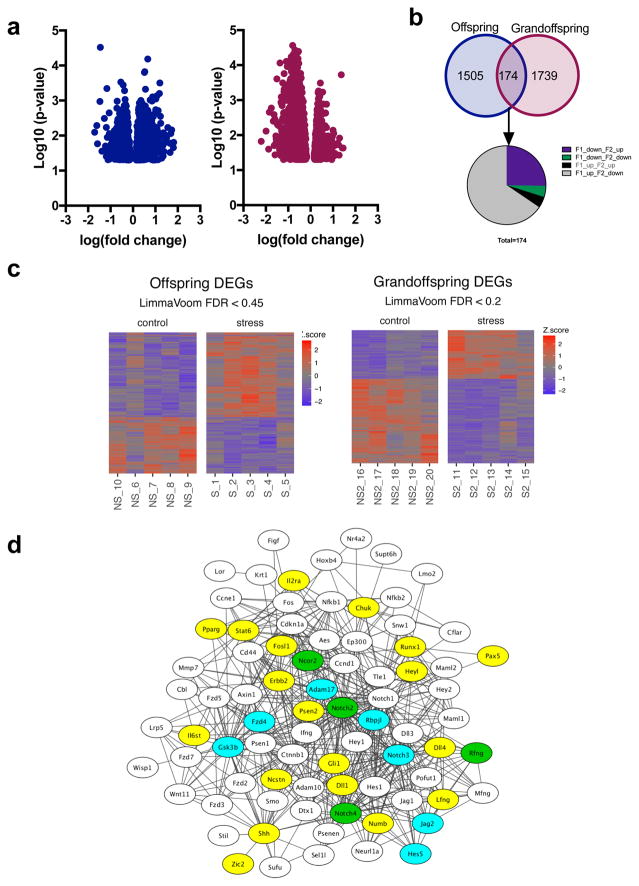
Figure 3. DEGs identified from RNA-sequencing of the amygdala from male offspring and grandoffspring.
Volcano plots of the DEGs identified in the offspring and grandoffspring (a). Venn Diagram of the DEGs identified individually in the offspring or the grandoffspring and common between the two generations. Of the 174 common genes, a majority of the genes that are upregulated in offspring are downregulated in grandoffspring, and vice versa (b). Heat maps of DEGs identified in the 5 samples identified in each experimental group: stress derived male offspring vs. no stress derived male offspring, and stress derived male grandoffspring vs no stress derived male offspring (c). Network analysis of notch signaling pathway (d). DEGs identified in RNA-seq only are blue, genes with over 1.5fold differential expression in qPCR are yellow, and overlapping genes are green.

