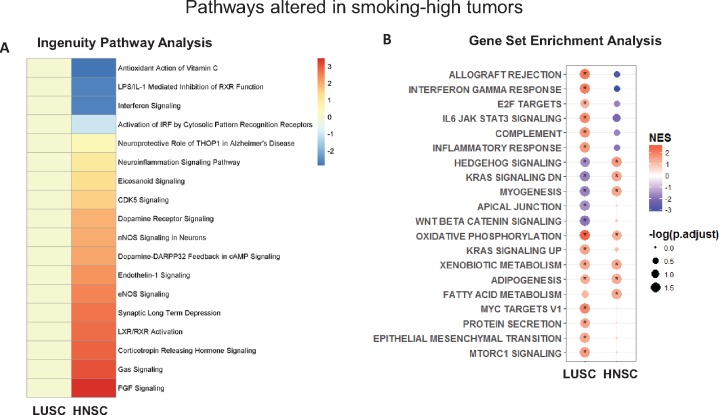
Figure 3.
A) Heatmap of Ingenuity Pathway Analysis–defined canonical pathways altered in either head and neck squamous cell carcinoma (HNSC) or lung squamous cell carcinoma (LUSC), showing an immunosuppressive phenotype in smoking-high HNSC, with the color legend representing directional z-score (Supplementary Tables 8 and 9, available online). B) Dot plot of results from Gene Set Enrichment Analysis (GSEA) of pathways enriched in smoking-high tumors, showing a pro-inflammatory phenotype in smoking-high LUSC, but an immunosuppressive phenotype in smoking-high HNSC. Complete expression data of smoking-high and smoking-low LUSC and HNSC (human papillomavirus–negative only) were analyzed for enrichment of GSEA hallmark gene sets, and results are plotted by color (normalized enrichment score; legend on the upper right) and size (–log false discovery rate [FDR]–adjusted P value; legend on the lower right, with * indicating FDR-adjusted P < .05). HNSC = head and neck squamous cell carcinoma; LUSC = lung squamous cell carcinoma; NES = normalized enrichment score.

