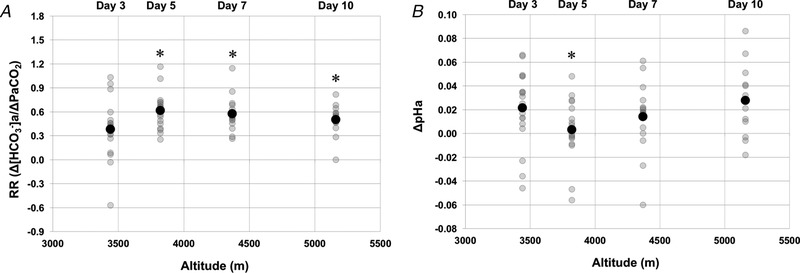
Figure 3. The relationship between ΔpHa and RR with ascent to high altitude.

A, RR (Δ[HCO3 −]a)/Δ). B, ΔpHa. A black circle indicates mean values. Delta values at each altitude are compared to baseline values (see Eqn (2)). *Statistically significant difference from 3440 m (P < 0.05). Days reported represent days of altitude exposure.
