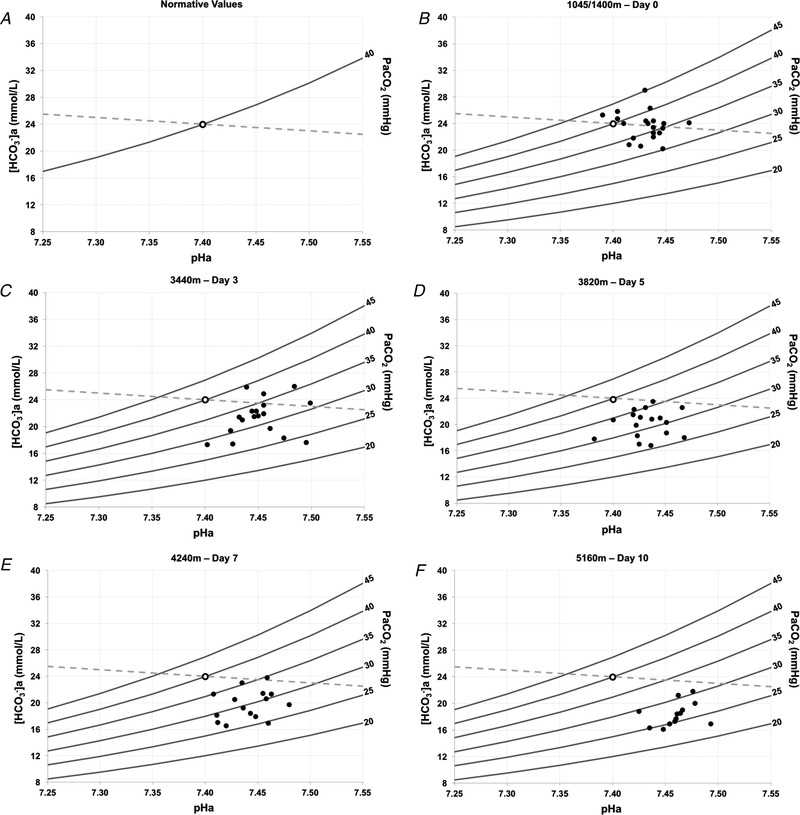
Figure 5. Davenport acid‐base diagrams during incremental ascent to high altitude.

Demonstration of the Henderson‐Hasselbalch relationship depicting acid‐base disturbances and their corresponding compensations, including arterial blood pHa (x‐axis), [HCO3 − a] (y‐axis), isopleths and the [non‐HCO3 − buffer] slope. Solid grey lines represent partial pressure of isopleths. The dashed grey line represents the standard non‐HCO3 − buffer slope. A, template Davenport diagram illustrating the CO2 isopleths and the position of the reference baseline value, where arterial HCO3 − is 24 mmol L–1 (y‐axis), arterial pH (pHa) is 7.4 (x‐axis) and partial pressure of arterial is 40 mmHg. B, 1045/1400 m low altitude baseline for comparison (n = 20). C, 3440 m on day 3 of ascent (n = 18). D, 3820 m on day 5 of ascent (n = 17). E, 4240 m on day 7 of ascent (n = 15). F, 5160 m on day 10 of ascent (n = 13). Days reported represent days of altitude exposure.
