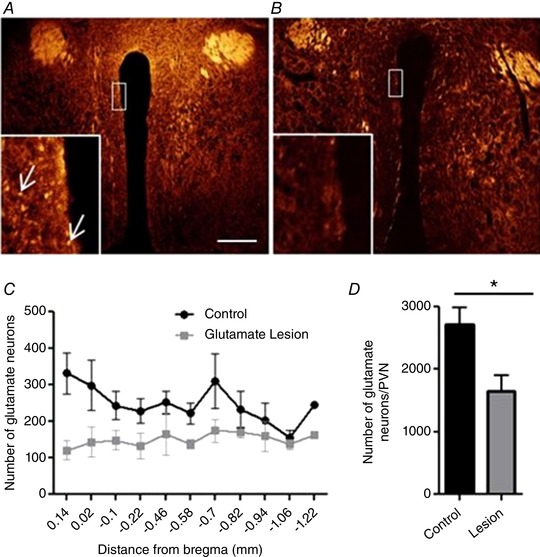
Figure 4. Virally mediated lesions of glutamate neurons in the PVN.

A, example of a vGlut2‐cre tdTomato control coronal cross‐section of the PVN (pseudo colour). Red/yellow neurons (indicated by arrows) are glutamate‐ and td‐Tomato‐positive with filter adjustment. B, example of the PVN following bilateral injections of AAV‐flex‐taCasp3‐TEVp, partially lesioning the glutamatergic population of neurons. C, rostro‐caudal quantification of distribution of glutamate neurons in the PVN. D, total number of glutamate neurons counted in control vs. lesioned animals throughout the PVN. * P < 0.05, n = 3–4/group (Student's t test), scale bar 200 μm. [Color figure can be viewed at wileyonlinelibrary.com]
