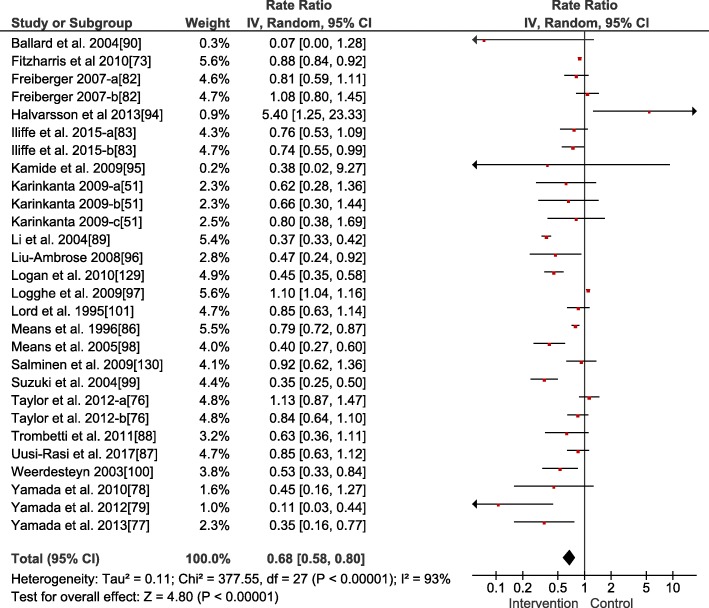
Fig. 2.
Forest plot for the meta-analysis of the fall rate (n = 4334). An inverse variance (IV) analysis was performed, and the 95% confidence interval (CI) is provided. The studies followed by the letters a or b or c mean that they include different intervention groups, and each letter resembles one intervention group

