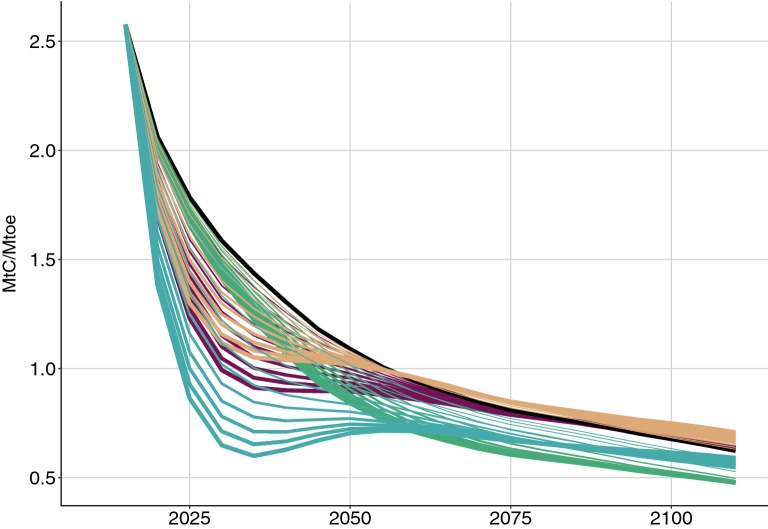
Fig. 4.
Carbon efficiencies of energy production (Mt C sequestered per Mtoe produced) for the three intensification scenarios separately (D, Ov, and M) and all three scenarios combined (D + Ov + M) between 2010 and 2115. Carbon efficiencies were calculated as cumulated total carbon balance (Mt C) divided by cumulated energy production (Mtoe). Blue shows all three scenarios combined (D + Ov + M), brown shows intensification of actively managed sites (M), red shows intensification of harvest-delayed sites (D), green shows intensification of overstocked sites (Ov), and black shows business as usual management of all sites (BaU). The intensification scenarios are presented in section “Methods”—Intensifying forest management and summarized in Table 3

