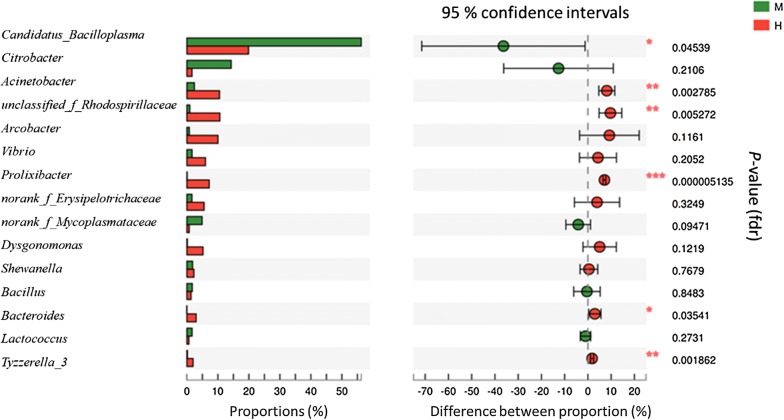
Fig. 2.
Student’s t-test bar plot on genus level of bacterial communities in the intestinal tract samples. The ordinate indicates the name of the genus level, the abscissa represents the percentage of the abundance of the sample. The color of the bar represents different groups M: midgut (green), H: hindgut (red). 0.01 < P ≤ 0.05*, 0.001 < P ≤ 0.01**, P ≤ 0.001***

