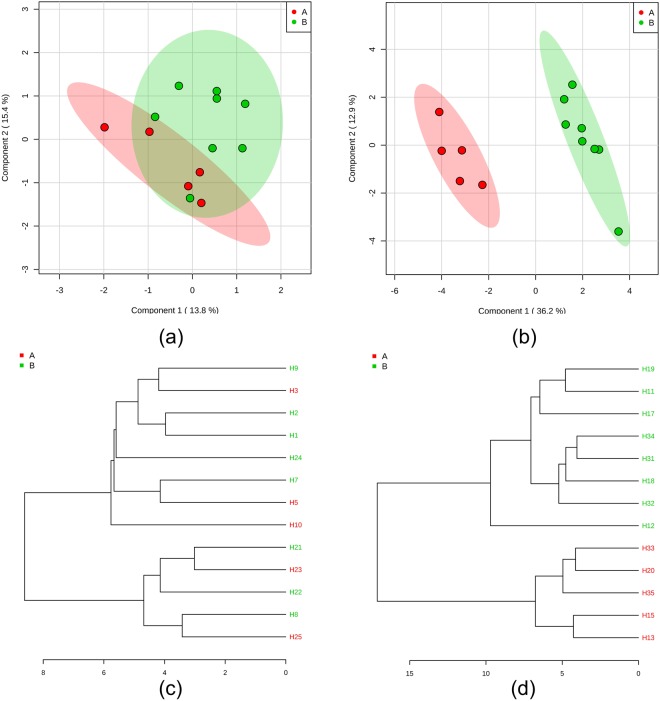
Figure 2.
Separation of the blood sample between the two groups in the baseline and follow-up using the metabolomic data. (a) This PLS-DA score plot shows that in the baseline, the plasma of the two groups cannot be separated using the target metabolite information; (b) in the follow-up, the plasma of the two groups can clearly be separated using the target metabolite information; (c) in the baseline, the dendrogram cannot be used to visualize the clustering of the two groups using PLS-DA analysis; (d) however, after different treatments, the dendrogram shows obvious clustering of the two groups as analysed by PLS-DA.

