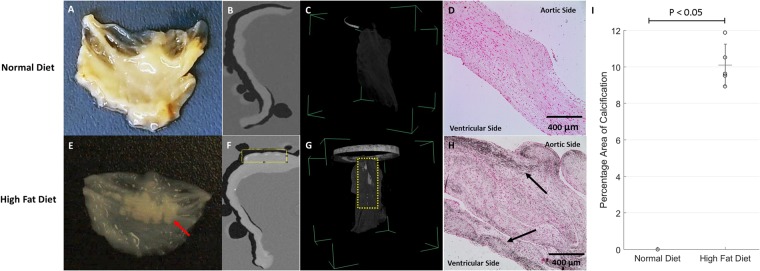
Figure 1.
Gross examination (n = 12), Micro Computerized Tomography (CT) Scan (n = 4), and Von Kossa Stain (n = 10) of Metabolic Syndrome Pig Aortic Cusps after 16 Weeks. Normal diet cusp showing no calcification via (A) gross examination, (B) sliced 2D cross-sectional view, (C) 3D volume rendering, and D) no evidence of calcium deposit utilizing Von Kossa. High fat diet cusp showing (E) Deposited calcific nodules observed (red arrow), (F) sliced 2D cross-sectional view showing areas of opacity (yellow box) along the cusp periphery, (G) 3D volume rendering showing opacity, and H) darken areas (denoted with arrows) shows calcium deposits that are specific to the cusp periphery. (I) The percentage area of calcification in the HF diet group statistical significance (P < 0.05).

