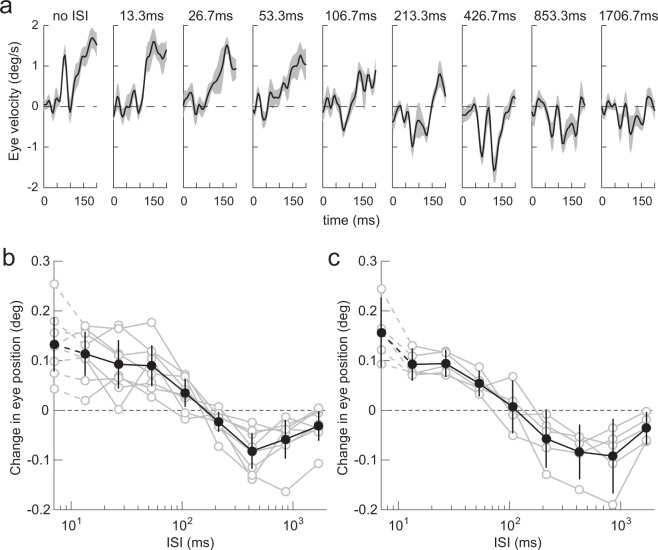
Figure 2.
ISI dependence. (a) Eye velocity profiles of ocular responses elicited by a 1/4-wavelength step of a square-wave grating (average over eight mice). Upward deflections denote eye movements in the direction of stimulus shift. The gray-hatched areas indicate 95% confidence intervals. The corresponding ISI is indicated at the top of each panel. (b) Dependence on ISI quantified from the data shown in (a). Data from individual mice (gray open circles, n = 8), and their average (black closed circles), are shown. Error bars are 95% confidence intervals. The responses when the ISI was zero are plotted on the vertical axis. Eye movements in the direction of stimulus shift are plotted as positive. Note the logarithmic abscissa. (c) Dependence on ISI of initial OKRs elicited by a 1/4-wavelength step of a sinusoidal grating. Other conventions are as in (b).

