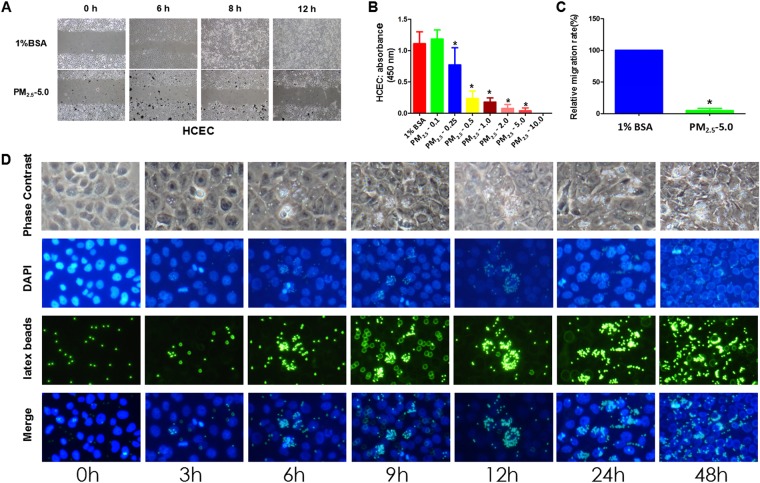
Figure 1.
Exposure to different concentrations of PM2.5 leads to changes in HCEC proliferation and migration. Notes: (A,C) 1% BSA and 5.0 mg/ml PM2.5 were added to the HCEC culture after scratching; images of wound healing were recorded at 6 hours (h), 8 h, and 32 h. The relative migration rate of HCECs manifested an obvious decline in the PM2.5 group compared with that in the culture system supplemented with 1% BSA. (B) After treatment with different concentrations of PM2.5 (0.1 mg/ml, 0.25 mg/ml, 0.5 mg/ml, 1.0 mg/ml, 2.0 mg/ml, 5.0 mg/ml, or 10.0 mg/ml) for 8 and 12 hours, the growth of HCECs was assessed by the CCK-8 assay. The lowest value of the cell proliferative capacity was detected in the group with 5.0 mg/ml PM2.5. (D) Uptake of latex beads into HCECs. HCECs were treated with fluorescence-labeled latex beads (shown in green) for 3 h, 6 h, 9 h, 12 h, 24 h, and 48 h. Cell nuclei were stained with DAPI (shown in blue). The amount of latex bead intracellular intake was time dependent and the beads accumulated near the nucleus of HCECs. Each value represents the mean ± the SD, n = 3. *P < 0.05 vs. 1% BSA.

