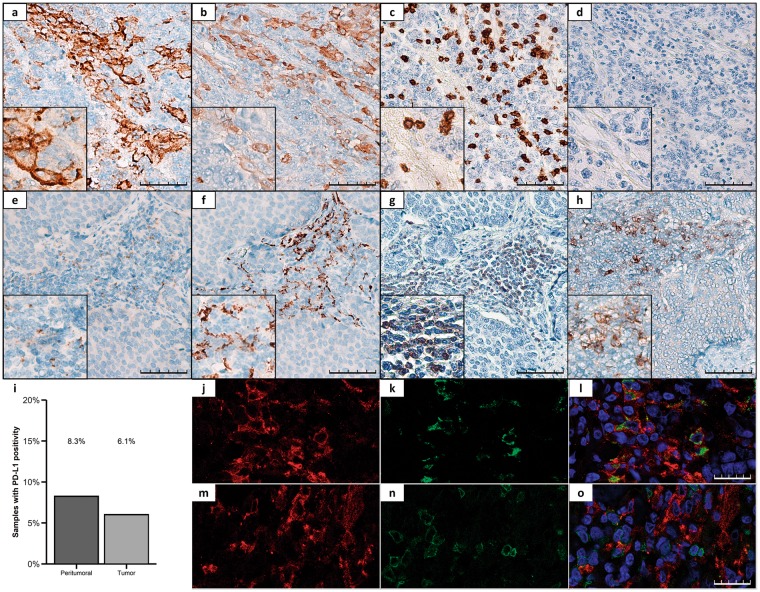
Figure 1.
Representative immunohistochemical staining patterns of PD-L1 in GEP-NETs. (a–d) TMA sections of a G3 pancreatic NET. (a) Positive membranous staining for PD-L1 in cancer cells. (b) CD163 expression in peritumoral macrophages. (c) CD3 expression in peritumoral lymphocytes. (d) Negative expression of PD-1. (e–h) TMA sections of a G2 intestinal NET. (e) Positive membranous staining for PD-L1 in peritumoral infiltrating cells. (f) CD163 expression in peritumoral macrophages. (g) CD3 expression in peritumoral lymphocytes. (h) Positive expression of PD-1. Original magnification with 20x and 40x (insets). Scale bar for 100 µm is represented with a line for each panel. (i) PD-L1 expression was measured by IHC in a set of TMAs (n = 164) of GEP-NETs. Bar graph values represent the percentage of samples with positivity for PD-L1 expression in the peritumoral and in tumoral tissue. (j–o) Immunofluorescence (IF) staining in a G3 intestinal NET. (j,m) Simple IF with PD-L1 (red). (k) Simple IF with CD68 (green). (l) Double IF with CD68 (green) and PD-L1 (red). (n) Simple IF with CD3 (green). (o) Double IF with CD3 (green) and PD-L1 (red). Scale bar for 25 µm is represented with a line for each panel.

