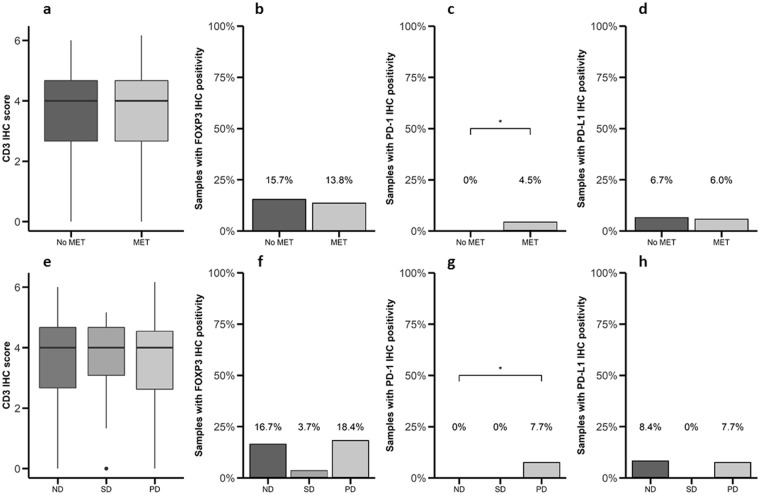
Figure 3.
Expression of PD-1 is associated to increased malignancy in patients with GEP-NETs. (a,e) CD3, (b,f) FOXP3, (c,g) PD-1 and (d,h) PD-L1 were measured by IHC in a set of TMAs (n = 164) of GEP-NETs. Values represent boxplot of CD3 IHC score and bar graphs of the percentage of samples with positivity for PD-1, FOXP3 and PD-L1 expression. (a–d) Samples were classified based on metastases status at diagnosis: patients with metastasis (MET) or without metastasis (No MET). (e–h) Samples were classified based on the disease status at follow-up evaluation: (1) non-residual disease, if a complete resection after surgery had been achieved and no tumor relapse/recurrence was evidenced; (2) stable disease, in cases of residual but non-progressive tumor burden; and (3) progressive disease, if tumor growth or new lesions were detected. The median of follow-up was 4.9 years (p25: 2.6–p75: 8.6 years). Asterisks indicate significant differences (p-value for Fisher’s Exact Test: *p < 0.05).

