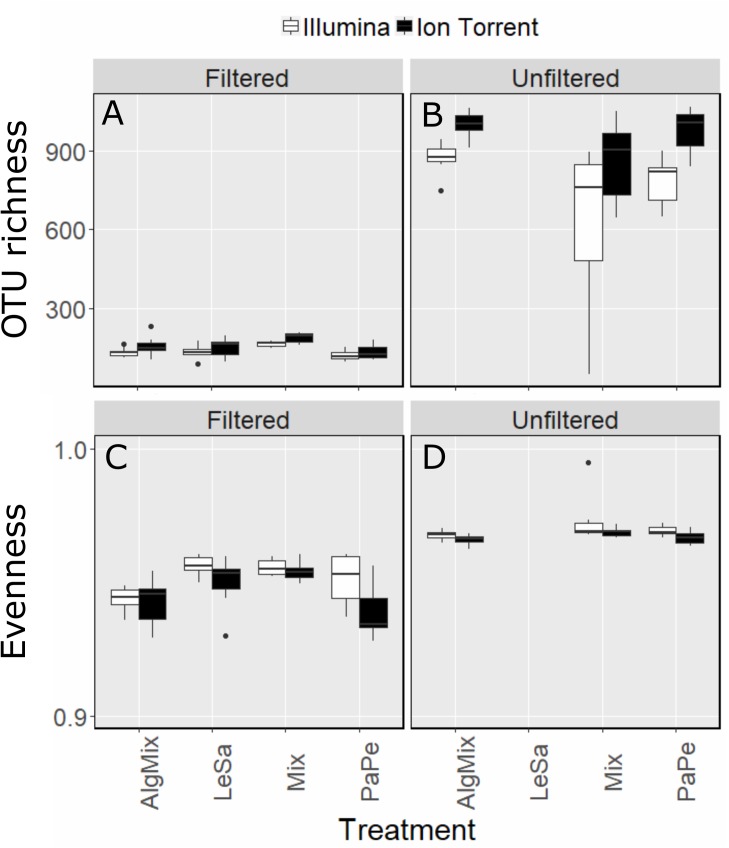
FIGURE 2.
Comparison between Illumina MiSeq (green bars) and Ion Torrent sequencing (gray bars) in reflecting OTU richness (A,B) and evenness (C,D) across the four treatment levels: Lepeophtheirus salmonis (LeSa), Paramoeba perurans (PaPe), algal mix (AlgMix) containing the three algal species, and Mix containing all the five species together. Within each panel the two different methods are compared.

