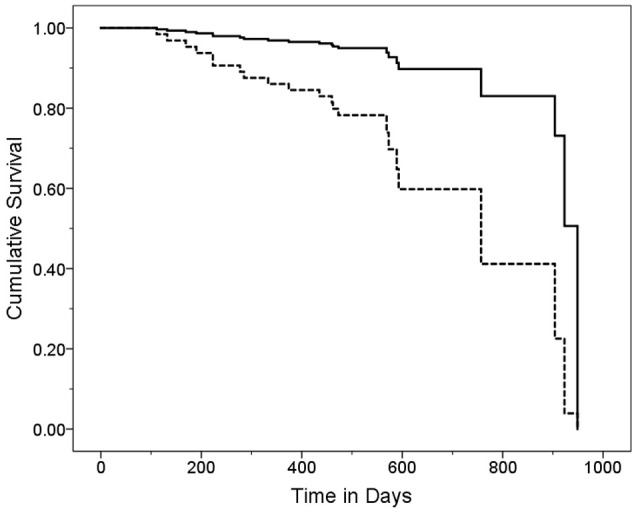
Figure 2.

Survival Curve by CDR Category. ET cases were stratified into two CDR score groups. Cases with higher CDR scores (solid line) had a mean ± standard deviation [median] CDR score = 0.75 ± 4.7 [0.5] years and cases with lower CDR scores (dashed line) had a mean ± standard deviation [median] CDR score = 0.0 ± 0.0 [0.0] years. Hazards ratio (95% Confidence Interval) in Cox proportional-hazards model = 4.76 (1.73–13.12), p = 0.003.
