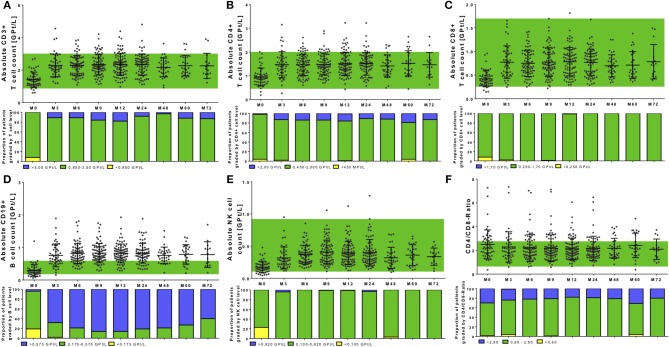
Figure 4.
Cell count of selective immune cell subpopulations during NAT treatment. Absolute cell count of CD3+ T cells (A), CD4+ T cells (B), CD8+ T cells (C), CD19+ B cells (D), NK cells (E), and the CD4+/CD8+-Ratio (F) are depicted. Data are shown for baseline analysis (M0), month 3 (M3), month 6 (M6), month 12 (M12), and every 12 months follow up (M24, M48, M60, M72). Mean ± standard deviation are presented. Green background indicates reference range of depicted parameters. Additionally, proportion of patients graded by lymphocyte subtype level are shown: lower than reference range (yellow), reference range (green) and higher than the reference range (blue). Level of significance are presented in Table 2.

