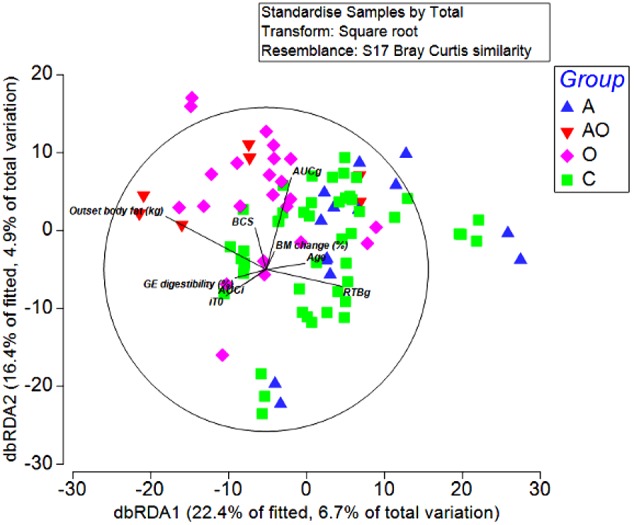
FIGURE 4.

Distance-based redundancy analysis illustrating associations between the fecal microbiome of Aged (A), Aged and Obese (AO), Obese (O), and Control (C) animals and outset host phenotype measures; Apparent digestibility of gross energy (GE digestibility), body condition score (BCS), areas under the curves for insulin (AUCi) and glucose (AUCg), and the time taken for glucose concentrations to return to baseline (RTBg) during a combined glucose/insulin tolerance test, outset body fat (kg), age (years), and percentage changes in body mass across the 4 week hay feeding periods [BM change (%)].
